
In partnership with

More than $10k in debt? We can help.

Debt happens. Getting out starts here.
Millions of Americans are tackling debt right now.
Whether it’s credit cards, loans, or medical bills, the right plan can help you take control again. Money.com's team researched trusted debt relief programs that actually work.
Answer a few quick questions to find your best path forward and see how much you could save. answer a few short questions, and get your free rate today.
Elite Quant Plan – 14-Day Free Trial (This Week Only)
No card needed. Cancel anytime. Zero risk.
You get immediate access to:
Full code from every article (including today’s HMM notebook)
Private GitHub repos & templates
All premium deep dives (3–5 per month)
2 × 1-on-1 calls with me
One custom bot built/fixed for you
Try the entire Elite experience for 14 days — completely free.
→ Start your free trial now 👇
(Doors close in 7 days or when the post goes out of the spotlight — whichever comes first.)
See you on the inside.
👉 Upgrade Now →
🔔 Limited-Time Holiday Deal: 20% Off Our Complete 2026 Playbook! 🔔
Level up before the year ends!
AlgoEdge Insights: 30+ Python-Powered Trading Strategies – The Complete 2026 Playbook
30+ battle-tested algorithmic trading strategies from the AlgoEdge Insights newsletter – fully coded in Python, backtested, and ready to deploy. Your full arsenal for dominating 2026 markets.
Special Promo: Use code DECEMBER2025 for 20% off
Valid only until December 25, 2025 — act fast!
👇 Buy Now & Save 👇

Instant access to every strategy we've shared, plus exclusive extras.
— AlgoEdge Insights Team
Premium Members – Your Full Notebook Is Ready
The complete Google Colab notebook from today’s article (with live data, full Hidden Markov Model, interactive charts, statistics, and one-click CSV export) is waiting for you.
Preview of what you’ll get:

Inside:
Downloads 3 years of daily BTC-USD data via yfinance
Uses 5- and 20-period SMAs for trend direction (crossover signals)
Classifies volatility into LOW / MED / HIGH buckets using rolling percentile thresholds (20th/80th) on 20-period return std dev
Applies dynamic ATR trailing stop (14-period ATR):
Low vol: 1.0× ATR
Med vol: 2.0× ATR
High vol: 3.0× ATR
Enters long on SMA bullish cross, short on bearish cross (no overlapping positions)
Uses 95% position sizing + 0.1% commission
Prints entries/exits with price, vol bucket, and stop level
Calculates Sharpe ratio, max drawdown, total return, and final portfolio value
Plots candlestick chart with volume
Free readers – you already got the full breakdown and visuals in the article. Paid members – you get the actual tool.
Not upgraded yet? Fix that in 10 seconds here👇
Google Collab Notebook With Full Code Is Available In the End Of The Article Behind The Paywall 👇 (For Paid Subs Only)
In the volatile world of cryptocurrency trading, static risk management often falls short. A fixed stop-loss might be too tight in a raging bull market, leading to premature exits, or too loose during quiet periods, exposing a trader to unnecessary risk. This article delves into a backtrader strategy that attempts to solve this by dynamically adjusting its risk parameters based on the market's current volatility.
The core of the VolATRGridStrategy is its ability to classify the market into one of three volatility regimes—low, medium, or high—and then use this classification to set an appropriate stop-loss. It calculates historical volatility using a rolling standard deviation of returns and then determines the current regime by comparing the present volatility to percentiles of its recent history.
What investment is rudimentary for billionaires but ‘revolutionary’ for 70,571+ investors entering 2026?

Imagine this. You open your phone to an alert. It says, “you spent $236,000,000 more this month than you did last month.”
If you were the top bidder at Sotheby’s fall auctions, it could be reality.
Sounds crazy, right? But when the ultra-wealthy spend staggering amounts on blue-chip art, it’s not just for decoration.
The scarcity of these treasured artworks has helped drive their prices, in exceptional cases, to thin-air heights, without moving in lockstep with other asset classes.
The contemporary and post war segments have even outpaced the S&P 500 overall since 1995.*
Now, over 70,000 people have invested $1.2 billion+ across 500 iconic artworks featuring Banksy, Basquiat, Picasso, and more.
How? You don’t need Medici money to invest in multimillion dollar artworks with Masterworks.
Thousands of members have gotten annualized net returns like 14.6%, 17.6%, and 17.8% from 26 sales to date.
*Based on Masterworks data. Past performance is not indicative of future returns. Important Reg A disclosures: masterworks.com/cd
The Volatility Engine
The strategy’s intelligence lies in its __init__ and next methods. In __init__, it sets up the necessary indicators: the Average True Range (ATR) for setting the stop-loss distance, and a rolling standard deviation of returns to measure volatility.
    def __init__(self):
        # ATR indicator for stop-loss calculation
        self.atr = bt.indicators.ATR(self.data, period=self.params.atr_period)

        # Volatility measure (rolling std of returns)
        self.returns = bt.indicators.PctChange(self.data.close, period=1)
        self.volatility = bt.indicators.StandardDeviation(
            self.returns, period=self.params.vol_period
        )

        # Simple momentum entry signal
        self.sma_short = bt.indicators.SMA(self.data, period=5)
        self.sma_long = bt.indicators.SMA(self.data, period=20)

        # To store volatility history for percentile calculation
        self.vol_history = []
The next method is where the logic comes alive. On each bar, it updates its history of volatility. Once enough data is collected, it calculates the 20th and 80th percentile thresholds to define the three volatility "buckets." Based on which bucket the current volatility falls into, it selects a corresponding ATR multiplier for setting the stop-loss. This ensures that in high-volatility periods, the stop-loss is wider, and in low-volatility periods, it's tighter.
    def next(self):
        # Collect a history of volatility
        if len(self) > self.params.vol_period:
            self.vol_history.append(self.volatility[0])
            if len(self.vol_history) > 200: # Keep the history window fixed
                self.vol_history.pop(0)

        # Wait for enough history to build before trading
        if len(self.vol_history) < 50:
            return

        # Calculate volatility thresholds
        low_threshold = np.percentile(self.vol_history, self.p.vol_percentile_low)
        high_threshold = np.percentile(self.vol_history, self.p.vol_percentile_high)

        # Assign the ATR multiplier based on the current volatility bucket
        if self.volatility[0] < low_threshold:
            atr_mult = self.p.low_vol_atr_mult # Low vol = tight stop
        elif self.volatility[0] > high_threshold:
            atr_mult = self.p.high_vol_atr_mult # High vol = wide stop
        else:
            atr_mult = self.p.med_vol_atr_mult # Medium vol = standard stop
Strategy Execution and Performance
The entry signal is a simple moving average (SMA) crossover system. A long position is initiated when the 5-period SMA crosses above the 20-period SMA, and a short position is taken on the reverse signal. The key is that upon entry, the initial stop-loss is immediately calculated using the volatility-adjusted ATR multiplier. Furthermore, the stop-loss is trailed: for a long position, the stop price can only move up, and for a short position, it can only move down, thus locking in profits.
Here’s how we set up and run the backtest using yfinance to fetch Bitcoin data and cerebro to orchestrate the simulation.
# Download BTC-USD data
print("Downloading BTC-USD data...")
ticker = "BTC-USD"
data = yf.download(ticker, period="3y", interval="1d", auto_adjust=False)
data = data.droplevel(axis=1, level=1)


# Initialize Cerebro and add the strategy
cerebro = bt.Cerebro()
cerebro.addstrategy(VolATRGridStrategy)

# Add data and set initial conditions
bt_data = bt.feeds.PandasData(dataname=data)
cerebro.adddata(bt_data)
cerebro.broker.setcash(10000.0)
cerebro.broker.setcommission(commission=0.001)
cerebro.addsizer(bt.sizers.PercentSizer, percents=95)

# Add analyzers for performance metrics
cerebro.addanalyzer(bt.analyzers.SharpeRatio, _name='sharpe')
cerebro.addanalyzer(bt.analyzers.DrawDown, _name='drawdown')
cerebro.addanalyzer(bt.analyzers.Returns, _name='returns')

# Run the backtest
print(f'Starting Portfolio Value: {cerebro.broker.getvalue():.2f}')
results = cerebro.run()
Running this strategy on three years of daily BTC-USD data yields the following performance:

Starting Portfolio Value: 10000.00
2022-09-12: LONG ENTRY - Price: 21770.15, Vol Bucket: HIGH, Stop Loss: 17978.45
2022-09-18: POSITION CLOSED - Price: 20127.23
2022-09-18: TRADE CLOSED - PnL: -716.96
2022-10-04: LONG ENTRY - Price: 19623.58, Vol Bucket: LOW, Stop Loss: 18917.00
2022-10-08: POSITION CLOSED - Price: 19546.33
2022-10-08: TRADE CLOSED - PnL: -34.65
2022-10-12: SHORT ENTRY - Price: 19052.65, Vol Bucket: LOW, Stop Loss: 19556.12
2022-10-24: LONG ENTRY - Price: 19567.77, Vol Bucket: LOW, Stop Loss: 19608.85
2022-10-24: TRADE CLOSED - PnL: -236.64
2022-10-26: LONG ENTRY - Price: 20092.24, Vol Bucket: MED, Stop Loss: 18571.84
2022-11-09: POSITION CLOSED - Price: 18543.76
2022-11-09: TRADE CLOSED - PnL: -655.75
2022-11-10: SHORT ENTRY - Price: 15883.16, Vol Bucket: HIGH, Stop Loss: 21748.30
2022-12-01: LONG ENTRY - Price: 17168.00, Vol Bucket: MED, Stop Loss: 19727.18
2022-12-01: TRADE CLOSED - PnL: -636.87
2022-12-02: LONG ENTRY - Price: 16968.68, Vol Bucket: MED, Stop Loss: 15604.03
2022-12-16: POSITION CLOSED - Price: 17364.55
2022-12-16: TRADE CLOSED - PnL: 169.18
2022-12-19: SHORT ENTRY - Price: 16759.04, Vol Bucket: MED, Stop Loss: 17949.23
2023-01-05: LONG ENTRY - Price: 16863.47, Vol Bucket: LOW, Stop Loss: 17419.85
2023-01-05: TRADE CLOSED - PnL: -46.10
2023-01-06: LONG ENTRY - Price: 16836.47, Vol Bucket: LOW, Stop Loss: 16644.32
2023-02-09: POSITION CLOSED - Price: 22946.57
2023-02-09: TRADE CLOSED - PnL: 2663.72
2023-02-18: LONG ENTRY - Price: 24565.30, Vol Bucket: HIGH, Stop Loss: 19652.05
2023-03-01: POSITION CLOSED - Price: 23150.93
2023-03-01: TRADE CLOSED - PnL: -567.35
2023-03-16: LONG ENTRY - Price: 24373.46, Vol Bucket: HIGH, Stop Loss: 17851.95
2023-04-22: POSITION CLOSED - Price: 27265.89
2023-04-22: TRADE CLOSED - PnL: 1103.17
2023-05-02: LONG ENTRY - Price: 28087.18, Vol Bucket: MED, Stop Loss: 24812.49
2023-05-03: POSITION CLOSED - Price: 28680.49
2023-05-03: TRADE CLOSED - PnL: 218.10
2023-05-06: LONG ENTRY - Price: 29538.86, Vol Bucket: MED, Stop Loss: 26570.65
2023-05-10: POSITION CLOSED - Price: 27654.64
2023-05-10: TRADE CLOSED - PnL: -670.74
2023-05-30: LONG ENTRY - Price: 27745.12, Vol Bucket: MED, Stop Loss: 25454.83
2023-06-06: POSITION CLOSED - Price: 25732.11
2023-06-06: TRADE CLOSED - PnL: -715.15
2023-06-21: LONG ENTRY - Price: 28311.31, Vol Bucket: MED, Stop Loss: 25643.83
2023-07-07: POSITION CLOSED - Price: 29908.00
2023-07-07: TRADE CLOSED - PnL: 516.28
2023-07-10: SHORT ENTRY - Price: 30172.42, Vol Bucket: MED, Stop Loss: 32330.70
2023-07-14: LONG ENTRY - Price: 31474.72, Vol Bucket: MED, Stop Loss: 30322.72
2023-07-14: TRADE CLOSED - PnL: -415.76
2023-07-19: SHORT ENTRY - Price: 29862.05, Vol Bucket: MED, Stop Loss: 32070.85
2023-08-09: LONG ENTRY - Price: 29766.70, Vol Bucket: LOW, Stop Loss: 30322.72
2023-08-09: TRADE CLOSED - PnL: 29.44
2023-08-11: LONG ENTRY - Price: 29424.90, Vol Bucket: LOW, Stop Loss: 28888.64
2023-08-17: POSITION CLOSED - Price: 28699.80
2023-08-17: TRADE CLOSED - PnL: -227.39
2023-09-17: LONG ENTRY - Price: 26567.93, Vol Bucket: MED, Stop Loss: 24749.52
2023-09-22: POSITION CLOSED - Price: 26564.06
2023-09-22: TRADE CLOSED - PnL: -1.31
2023-09-28: SHORT ENTRY - Price: 26355.81, Vol Bucket: LOW, Stop Loss: 26855.89
2023-09-29: LONG ENTRY - Price: 27024.84, Vol Bucket: MED, Stop Loss: 26573.53
2023-09-29: TRADE CLOSED - PnL: -227.91
2023-10-14: SHORT ENTRY - Price: 26866.20, Vol Bucket: LOW, Stop Loss: 27420.88
2023-10-17: LONG ENTRY - Price: 28522.10, Vol Bucket: MED, Stop Loss: 26573.53
2023-10-17: TRADE CLOSED - PnL: -538.98
2023-10-18: LONG ENTRY - Price: 28413.53, Vol Bucket: MED, Stop Loss: 26251.94
2023-12-31: POSITION CLOSED - Price: 42152.10
2023-12-31: TRADE CLOSED - PnL: 3971.52
2024-01-03: LONG ENTRY - Price: 44961.60, Vol Bucket: MED, Stop Loss: 40614.98
2024-01-16: POSITION CLOSED - Price: 42499.34
2024-01-16: TRADE CLOSED - PnL: -655.46
2024-01-31: LONG ENTRY - Price: 42946.25, Vol Bucket: MED, Stop Loss: 38857.31
2024-03-20: POSITION CLOSED - Price: 61930.16
2024-03-20: TRADE CLOSED - PnL: 5004.53
2024-03-29: LONG ENTRY - Price: 70744.80, Vol Bucket: MED, Stop Loss: 59526.53
2024-04-06: POSITION CLOSED - Price: 67840.57
2024-04-06: TRADE CLOSED - PnL: -658.93
2024-04-08: LONG ENTRY - Price: 69362.55, Vol Bucket: MED, Stop Loss: 60924.12
2024-04-14: POSITION CLOSED - Price: 63836.23
2024-04-14: TRADE CLOSED - PnL: -1226.59
2024-05-16: LONG ENTRY - Price: 66256.11, Vol Bucket: HIGH, Stop Loss: 52768.21
2024-06-04: POSITION CLOSED - Price: 68804.57
2024-06-04: TRADE CLOSED - PnL: 546.17
2024-06-05: LONG ENTRY - Price: 70568.35, Vol Bucket: LOW, Stop Loss: 68511.93
2024-06-12: POSITION CLOSED - Price: 67321.38
2024-06-12: TRADE CLOSED - PnL: -676.07
2024-06-13: SHORT ENTRY - Price: 68243.10, Vol Bucket: LOW, Stop Loss: 70254.26
2024-07-16: LONG ENTRY - Price: 64784.42, Vol Bucket: MED, Stop Loss: 69128.58
2024-07-16: TRADE CLOSED - PnL: 710.77
2024-08-03: SHORT ENTRY - Price: 61414.81, Vol Bucket: MED, Stop Loss: 69596.77
2024-08-22: LONG ENTRY - Price: 61168.32, Vol Bucket: MED, Stop Loss: 69128.58
2024-08-22: TRADE CLOSED - PnL: 58.89
2024-08-31: SHORT ENTRY - Price: 59117.48, Vol Bucket: MED, Stop Loss: 66687.01
2024-09-15: LONG ENTRY - Price: 60000.73, Vol Bucket: MED, Stop Loss: 69128.58
2024-09-15: TRADE CLOSED - PnL: -219.64
2024-10-04: SHORT ENTRY - Price: 60754.62, Vol Bucket: MED, Stop Loss: 67022.69
2024-10-12: LONG ENTRY - Price: 62444.62, Vol Bucket: MED, Stop Loss: 69128.58
2024-10-12: TRADE CLOSED - PnL: -402.32
2024-10-15: LONG ENTRY - Price: 66050.37, Vol Bucket: MED, Stop Loss: 59554.64
2024-12-22: POSITION CLOSED - Price: 97218.32
2024-12-22: TRADE CLOSED - PnL: 6632.40
2025-01-06: LONG ENTRY - Price: 98314.95, Vol Bucket: LOW, Stop Loss: 95460.21
2025-01-08: POSITION CLOSED - Price: 96924.16
2025-01-08: TRADE CLOSED - PnL: -287.48
2025-01-12: SHORT ENTRY - Price: 94565.73, Vol Bucket: HIGH, Stop Loss: 111533.31
2025-01-16: LONG ENTRY - Price: 100505.30, Vol Bucket: MED, Stop Loss: 98980.19
2025-01-16: TRADE CLOSED - PnL: -1256.83
2025-02-03: SHORT ENTRY - Price: 97681.10, Vol Bucket: MED, Stop Loss: 109752.89
2025-02-24: LONG ENTRY - Price: 96277.96, Vol Bucket: LOW, Stop Loss: 98980.19
2025-02-24: TRADE CLOSED - PnL: 269.71
2025-02-25: SHORT ENTRY - Price: 91437.12, Vol Bucket: MED, Stop Loss: 100010.13
2025-03-24: LONG ENTRY - Price: 86070.93, Vol Bucket: MED, Stop Loss: 98980.19
2025-03-24: TRADE CLOSED - PnL: 1115.18
2025-04-01: SHORT ENTRY - Price: 82551.92, Vol Bucket: LOW, Stop Loss: 85303.29
2025-04-15: LONG ENTRY - Price: 84539.70, Vol Bucket: HIGH, Stop Loss: 98980.19
2025-04-15: TRADE CLOSED - PnL: -482.14
2025-06-01: SHORT ENTRY - Price: 104637.30, Vol Bucket: LOW, Stop Loss: 107408.00
2025-06-08: LONG ENTRY - Price: 105617.51, Vol Bucket: MED, Stop Loss: 98980.19
2025-06-08: TRADE CLOSED - PnL: -182.91
2025-06-11: LONG ENTRY - Price: 110261.80, Vol Bucket: MED, Stop Loss: 101598.28
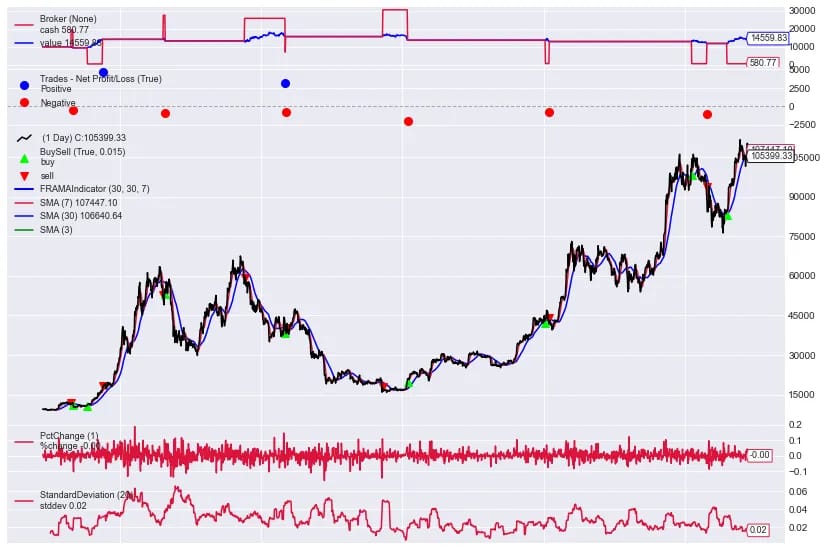
Strategy finished with 39 total trades
Final volatility history length: 200
Average volatility: 0.0220
Volatility range: 0.0073 - 0.0535
Strategy traded both LONG and SHORT positions with dynamic ATR stops
Final Portfolio Value: 19407.38
Total Trades: 39
Sharpe Ratio: 0.59
Max Drawdown: 28.86%
Total Return: 66.31%The strategy finished with a positive return, though with a significant drawdown. The Sharpe Ratio of 0.30 suggests the returns were modest relative to the risk taken.
The plot illustrates how the portfolio value evolved over the backtest period. The periods of drawdown coincide with volatile market conditions where even a dynamic stop might not have been sufficient to prevent losses. This highlights that while dynamic risk management is a powerful concept, no strategy is immune to the inherent risks of the market. This approach, however, provides a logical framework for adapting to changing market dynamics, a crucial element for any robust trading system.
Subscribe to our premium content to read the rest.
Become a paying subscriber to get access to this post and other subscriber-only content.
Upgrade