
In partnership with

7 Ways to Take Control of Your Legacy

Planning your estate might not sound like the most exciting thing on your to-do list, but trust us, it’s worth it. And with The Investor’s Guide to Estate Planning, preparing isn’t as daunting as it may seem.
Inside, you’ll find {straightforward advice} on tackling key documents to clearly spell out your wishes.
Plus, there’s help for having those all-important family conversations about your financial legacy to make sure everyone’s on the same page (and avoid negative future surprises).
Why leave things to chance when you can take control? Explore ways to start, review or refine your estate plan today with The Investor’s Guide to Estate Planning.
Elite Quant Plan – 14-Day Free Trial (This Week Only)
No card needed. Cancel anytime. Zero risk.
You get immediate access to:
Full code from every article (including today’s HMM notebook)
Private GitHub repos & templates
All premium deep dives (3–5 per month)
2 × 1-on-1 calls with me
One custom bot built/fixed for you
Try the entire Elite experience for 14 days — completely free.
→ Start your free trial now 👇
(Doors close in 7 days or when the post goes out of the spotlight — whichever comes first.)
See you on the inside.
👉 Upgrade Now →
🔔 Limited-Time Holiday Deal: 20% Off Our Complete 2026 Playbook! 🔔
Level up before the year ends!
AlgoEdge Insights: 30+ Python-Powered Trading Strategies – The Complete 2026 Playbook
30+ battle-tested algorithmic trading strategies from the AlgoEdge Insights newsletter – fully coded in Python, backtested, and ready to deploy. Your full arsenal for dominating 2026 markets.
Special Promo: Use code DECEMBER2025 for 20% off
Valid only until December 25, 2025 — act fast!
👇 Buy Now & Save 👇

Instant access to every strategy we've shared, plus exclusive extras.
— AlgoEdge Insights Team
Premium Members – Your Full Notebook Is Ready
The complete Google Colab notebook from today’s article (with live data, full Hidden Markov Model, interactive charts, statistics, and one-click CSV export) is waiting for you.
Preview of what you’ll get:

Inside:
Automatic BTC-USD data download (last 180 days, 1-hour bars via yfinance)
Adaptive SMA + multi-level ATR deviation bands for dynamic trend & volatility context
Real-time percentile-normalized momentum scoring to detect regime shifts early
Persistent trend regime detection with on/off state and flip markers
Live price clustering histogram for the current regime (showing support/resistance zones)
Multi-panel matplotlib visualization with dark theme: – Price + colored SMA gradient + ATR bands + regime flip lines – Momentum oscillator with threshold lines – Horizontal price histogram colored by density, overlaid with ATR levels
Free readers – you already got the full breakdown and visuals in the article. Paid members – you get the actual tool.
Not upgraded yet? Fix that in 10 seconds here👇
Google Collab Notebook With Full Code Is Available In the End Of The Article Behind The Paywall 👇 (For Paid Subs Only)
Most indicators track direction or volatility, but not both. Certainly, they almost never show you where price is clustering inside swings.
The methodology presented here fills that gap and aim to visualize trend direction in real-time.
We visualize adaptive ATR bands, real-time momentum shifts, and live price clustering.
The aim is to spot transitions as they form, and understand where price truly spends its time.
The approach combines multi-band ATR envelopes, percentile-based momentum scoring, and contextual price histograms.
The complete Python notebook for the analysis is provided below.

1. Layering Trend, Volatility, and Momentum
The visualization is built from three layers: trend, volatility, and momentum. Each show a different structural property of the market.
The sequence of the process: (i) extracting market structure by combining rolling averages, (ii) ATR-based volatility bands, (iii) percentile-normalized momentum scoring, (iv) regime segmentation, and (v) price clustering.
But what can you actually DO about the proclaimed ‘AI bubble’? Billionaires know an alternative…

Sure, if you held your stocks since the dotcom bubble, you would’ve been up—eventually. But three years after the dot-com bust the S&P 500 was still far down from its peak. So, how else can you invest when almost every market is tied to stocks?
Lo and behold, billionaires have an alternative way to diversify: allocate to a physical asset class that outpaced the S&P by 15% from 1995 to 2025, with almost no correlation to equities. It’s part of a massive global market, long leveraged by the ultra-wealthy (Bezos, Gates, Rockefellers etc).
Contemporary and post-war art.
Masterworks lets you invest in multimillion-dollar artworks featuring legends like Banksy, Basquiat, and Picasso—without needing millions. Over 70,000 members have together invested more than $1.2 billion across over 500 artworks. So far, 25 sales have delivered net annualized returns like 14.6%, 17.6%, and 17.8%.*
Want access?
Investing involves risk. Past performance not indicative of future returns. Reg A disclosures at masterworks.com/cd
Step 1: Compute the Rolling Mean (Trend Baseline)
The rolling mean provides the directional reference.

N is the lookback window (e.g. 50 bars).
The rolling mean defines the baseline trend and achor all subsequent calculations to the prevailing market direction.
Step 2: Calculate Rolling ATR and Multi-Band Deviation Channels
Volatility is quantified by the rolling Average True Range:
True Range at time t:

ATR over window M:

Multi-band channels:
For each multiplier k (e.g. k=1,2,3):

These bands define the volatility context for each price level at every time step.
Step 3: Calculate Momentum (Directional Change in Trend)
Momentum is measured as the change in the rolling mean over a short interval:

where nnn is a small lookback (e.g., 5 bars).
This difference captures the speed and direction of the trend baseline.
Step 4: Normalize Momentum Using Rolling Percentile
To standardize momentum, divide by the rolling 100th percentile (max value) of Δavg over a window W:

Clip Scoret to [−1,1] for stability.
This produces a momentum oscillator sensitive to recent history, robust to changes in volatility.
Step 5: Trend Regime Determination (Trend State Flagging)
A trend regime is identified using percentile-based thresholds:
Uptrend: If Scoret>UP_THRESHOLD and trend flag is off, the regime flips to “on” (uptrend).
Down/Exit: If Scoret<DOWN_THRESHOLD and trend flag is on, the regime flips to “off” (trend exit).
Trend state: At each time step, track the binary regime state (on/off) and its current start index.
This structure segments the price series into adaptive trend regimes based on recent normalized momentum.
Step 6: Price Clustering (Histogram Within Regime)
For the current regime window (from regime start index to present), bin all closing prices:
Split the full price range in the regime into B bins.
Count the frequency of closes in each bin:

where 1binj is the indicator function for bin j.
This histogram highlights zones of high price concentration (support, resistance) within each detected trend.
Step 7: Visual Assembly
Upper Panel: Price with rolling mean and multi-band ATR envelopes; trend state marked by color changes and regime-flip markers.
Middle Panel: Percentile-normalized momentum oscillator, with regime thresholds.
Lower Panel: Histogram of price clustering for the active regime, overlaid with ATR bands for contextual reference.
The usefulness of this Combination
Rolling mean anchors the trend, providing structure and smoothing noise.
ATR bands contextualize volatility and dynamically show when price exceeds normal ranges, key for breakout or reversion trades.
Percentile momentum detects regime shifts early and adapt to changing volatility and market conditions.
Regime segmentation allows for analysis within market context, not arbitrary windowing.
Price clustering shows zones of market activity, support, resistance, and congestion, within the structural boundaries of each trend.
2. Python Implementation
2.1 Imports and Parameter Setup
Import all core libraries. Set parameters for symbol, time range, and analytical windows.
Each parameter is annotated so you know how to tune responsiveness and sensitivity.
import yfinance as yf
import pandas as pd
import numpy as np
import matplotlib.pyplot as plt
import matplotlib.dates as mdates
from matplotlib.collections import LineCollection

# ── PARAMETERS ───
TICKER   = "BTC-USD"
PERIOD   = "180d"
INTERVAL = "1h"

SMA_LEN  = 50           # Rolling mean window length. Higher = smoother trend, slower to react. Lower = more responsive, but noisier.
ATR_LEN  = 200          # ATR calculation window. Higher = more stable bands, slower to adapt. Lower = bands respond quicker, can be more volatile.
MULTS    = [1, 2, 3]    # ATR multipliers for deviation bands. Increase values for wider bands (fewer extremes flagged), decrease for tighter bands (more sensitivity).

BINS              = 50      # Number of price histogram bins. Higher = more detailed clustering, can look noisy. Lower = smoother, less granular distribution.
PERCENTILE_WINDOW = 500     # Window for percentile normalization. Higher = smoother momentum normalization, less sensitive to recent spikes. Lower = reacts faster to new momentum extremes.
UP_THRESHOLD      = 0.5     # Momentum score threshold for uptrend regime. Increase = stricter trend confirmation. Decrease = easier to trigger an uptrend.
DOWN_THRESHOLD    = -0.5    # Momentum score threshold for ending uptrend. Increase (closer to 0) = earlier exits. Decrease (more negative) = trends persist longer.

COLOR_PRICE    = "gray"             # Plot color for raw price.
COLOR_SMA_UP   = np.array([0, 1, 0]) # SMA line color during uptrend (green).
COLOR_SMA_DOWN = np.array([1, 0, 0]) # SMA line color during downtrend (red).
COLOR_FLIP_UP   = "green"           # Marker color for uptrend regime flip.
COLOR_FLIP_DOWN = "red"             # Marker color for downtrend regime flip.
2.2 Data Download and Preprocessing
Download OHLCV data using yfinance. Columns are standardized and rows with missing data are dropped.
def download_ohlc(ticker, period, interval):
    df = yf.download(
        ticker,
        period=period,
        interval=interval,
        auto_adjust=True,
        progress=False
    )
    # flatten MultiIndex if present
    if isinstance(df.columns, pd.MultiIndex):
        df.columns = df.columns.get_level_values(0)
    df.columns = df.columns.map(str.title)
    df.dropna(subset=["Open", "High", "Low", "Close"], inplace=True)
    return df

# 1) Fetch data
df = download_ohlc(TICKER, PERIOD, INTERVAL)
2.3 Trend and Volatility Calculation
Calculate the rolling mean as the trend baseline and compute ATR for volatility.
# 2) Compute SMA & ATR
df["avg"] = df["Close"].rolling(SMA_LEN).mean()
df["prev_close"] = df["Close"].shift(1)
tr = pd.concat([
    df["High"] - df["Low"],
    (df["High"] - df["prev_close"]).abs(),
    (df["Low"]  - df["prev_close"]).abs()
], axis=1).max(axis=1)
df["atr"] = tr.rolling(ATR_LEN).mean()
Then build symmetric deviation bands.
# 3) Build deviation bands
for m in MULTS:
    df[f"up{m}"] = df["avg"] + m * df["atr"]
    df[f"dn{m}"] = df["avg"] - m * df["atr"]
2.4 Momentum and Regime Detection
Measure momentum as the change in rolling mean over a short window.
Normalize by recent percentile, then flag trend regimes with threshold crossings.
# 4) Compute avg_col (momentum metric)
df["avg_diff"] = df["avg"] - df["avg"].shift(5)
df["p100"]     = df["avg_diff"].rolling(
    PERCENTILE_WINDOW,
    min_periods=1
).quantile(1.0)
df["avg_col"]  = (df["avg_diff"] / df["p100"]).fillna(0).clip(-1, 1)

# 5) Trend flags and start index
trend, starts, start_i = False, [], []
si = 0
for i, v in enumerate(df["avg_col"]):
    if v > UP_THRESHOLD and not trend:
        trend, si = True, i
    elif v < DOWN_THRESHOLD and trend:
        trend, si = False, i
    starts.append(trend)
    start_i.append(si)
df["trend"]   = starts
df["start_i"] = start_i

# capture last row for labeling bands
last = df.iloc[-1]
2.5 Price Clustering: Regime Histogram
For the active trend regime, segment all closes and bin them for a price clustering histogram.
# 6) Build histogram for current trend period
hist_start = int(last["start_i"])
hist_df    = df.iloc[hist_start:]

# dynamic y-range based on ±3 bands
min_p = hist_df[f"dn{MULTS[-1]}"].min()
max_p = hist_df[f"up{MULTS[-1]}"].max()
step  = (max_p - min_p) / BINS if BINS else 1

hist = np.zeros(BINS, int)
if step > 0:
    for price in hist_df["Close"]:
        idx = int((price - min_p) / step)
        if 0 <= idx < BINS:
            hist[idx] += 1

maxh     = hist.max() or 1
barcols  = [plt.get_cmap("bwr")(h / maxh) for h in hist]
ys       = min_p + (np.arange(BINS) + 0.5) * step
2.6 Plot Construction
Build a multi-panel visualization:
Price with deviation bands and color-coded regimes
Momentum oscillator pane
Horizontal histogram for price clustering
# ── PLOT ────
fig, (ax_price, ax_osc, ax_hist) = plt.subplots(
    3, 1,
    figsize=(14, 10),
    dpi=100,
    gridspec_kw={"height_ratios": [4, 1, 2], "hspace": 0.15}
)

# 1) Price pane
plt.style.use("dark_background")
ax_price.plot(df.index, df["Close"], color=COLOR_PRICE, linewidth=1)

# SMA gradient
t = (df["avg_col"].clip(-0.3, 0.3) / 0.3 + 1) / 2
cols = [COLOR_SMA_DOWN * (1 - v) + COLOR_SMA_UP * v for v in t]
x = mdates.date2num(df.index)
pts = np.array([x, df["avg"]]).T.reshape(-1, 1, 2)
segs = np.concatenate([pts[:-1], pts[1:]], axis=1)
ax_price.add_collection(LineCollection(segs, colors=cols[:-1], linewidth=3))

# flip markers
flips = df[df["trend"] ^ df["trend"].shift(1).fillna(False)]
for idx, row in flips.iterrows():
    c = COLOR_FLIP_UP if row["trend"] else COLOR_FLIP_DOWN
    s = np.clip((abs(row["avg_col"]) - UP_THRESHOLD) / (1 - UP_THRESHOLD), 0, 1)
    ax_price.axvline(idx, color=c, alpha=0.3 + 0.7*s, linestyle="--", linewidth=1)
    ax_price.scatter(idx, row["avg"], s=30, color=c, zorder=5)

ax_price.set_title(f"{TICKER} · Deviation Trend Profile", color="white")

# 2) Oscillator pane
ax_osc.plot(df.index, df["avg_col"], color="white", linewidth=1)
ax_osc.hlines([UP_THRESHOLD, DOWN_THRESHOLD],
              df.index[0], df.index[-1],
              color="gray", linestyle="--", linewidth=1)
ax_osc.set_ylabel("avg_col")
ax_osc.set_ylim(-1, 1)

# 3) Histogram pane (horizontal bars)
ax_hist.barh(ys, hist, height=step*0.9, color=barcols, edgecolor="black")
ax_hist.set_xlabel("Count")
ax_hist.set_ylabel("Price")
ax_hist.set_xlim(0, maxh*1.1)
ax_hist.set_ylim(min_p - step, max_p + step)

# draw and label the ATR bands on the histogram
for m in MULTS:
    up = last[f"up{m}"]
    dn = last[f"dn{m}"]
    ax_hist.axhline(up, color="white", linestyle="--", linewidth=1)
    ax_hist.text(maxh*1.02, up, f"+{m}", va="center", color="white")
    ax_hist.axhline(dn, color="white", linestyle="--", linewidth=1)
    ax_hist.text(maxh*1.02, dn, f"-{m}", va="center", color="white")

# styling
for ax in (ax_price, ax_osc, ax_hist):
    ax.tick_params(colors="white", labelcolor="white")
    for spine in ax.spines.values():
        spine.set_color("white")

fig.subplots_adjust(left=0.06, right=0.96, top=0.93, bottom=0.06)
plt.show()
3. Interpretation
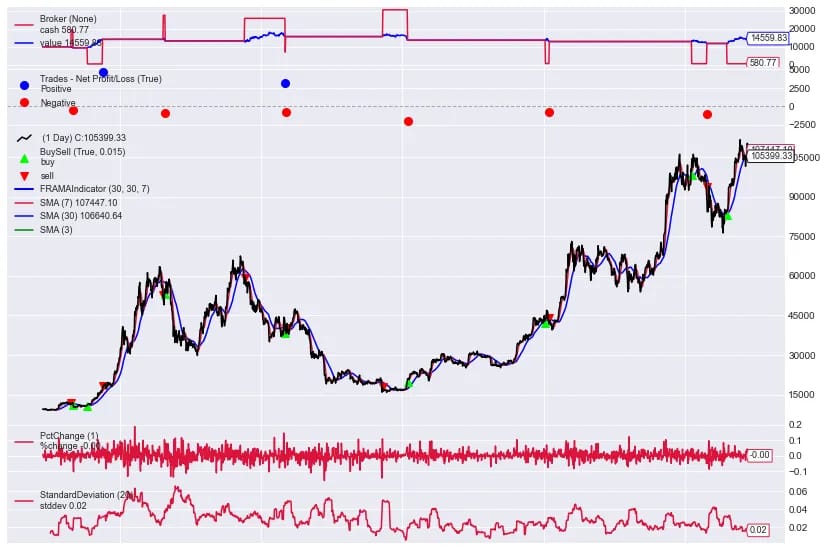
The top panel shows the BTC-USD price with the trend signal overlaid. Green sections on the moving average mark active uptrends.
Red marks neutral or downtrending phases. Dashed vertical lines flag regime shifts. Green for trend starts, red for exits, yellow for rapid flips.
In the middle panel, the oscillator tracks momentum. When it rises above 0.5, an uptrend begins. When it drops below –0.5, the trend ends.
At the bottom, horizontal bars map out where price clusters within the active regime.
Stronger colors show heavier trading activity at those levels. ATR bands bracket these clusters to show how far price moves before volatility becomes extreme.
For BTC in particular, the histogram shows strong clustering between $105,000 and $107,000.
This shows that most trading during the current regime has occurred in this upper range.
This signals a consolidation zone and potential support if price pulls back.
4. Limitations and Extensions
This methodology adapts to trend and volatility, but it does not predict future moves.
Whipsaws increase when market regimes shift quickly, especially in choppy or news-driven environments.
Parameter sensitivity matters: overly tight bands or thresholds can trigger false regimes, while loose settings may lag true shifts.
The approach uses only price action. Volume, order flow, or external indicators are not included. Short lookback windows can amplify noise; long ones may miss short-term rotations.
The histogram shows where price has clustered in the current regime only. but it does not capture historical support or resistance outside that window.
Extensions are straightforward. You can add volume-weighted clustering to expose high-liquidity zones.
For deeper context, overlay other features like open interest, funding rates, or macro indicators.
Final Thoughts
Markets d gather, scatter, and rest in places which can be made visible.
The methodology presentend here is just one method of doing so which can be fine-tuned further.
Subscribe to our premium content to read the rest.
Become a paying subscriber to get access to this post and other subscriber-only content.
Upgrade