
In partnership with

Someone just spent $236,000,000 on a painting. Here’s why it matters for your wallet.

Late last year, a Klimt sold for the highest price ever paid for modern art at auction.
An outlier sure, but it wasn't a fluke. U.S. auction sales grew 23.1% in 2025. The $1-5mm segment even grew 40.8% YoY.
Meanwhile, Apollo’s chief economist Torsten Slok said to expect ‘zero in return in the S&P 500 over the coming decade.’
Each environment is unique, but after dot-com, post war and contemporary art grew about 24% annually for a decade. After 2008, about 11% for 12 years.
It’s also had near-zero correlation with the S&P 500 since ‘95.*
Now, Masterworks lets you invest in shares of artworks featuring legends like Banksy, Basquiat, and Picasso.
$1.3 billion invested across over 500 artworks.
28 sales to date.
Net annualized returns on sold works held 12 months+ like 14.6%, 17.6%, and 17.8%.
Shares can sell quickly, but my subscribers can skip the waitlist:
*Investing involves risk. Past performance is not indicative of future returns. See important Reg A disclosures at masterworks.com/cd.
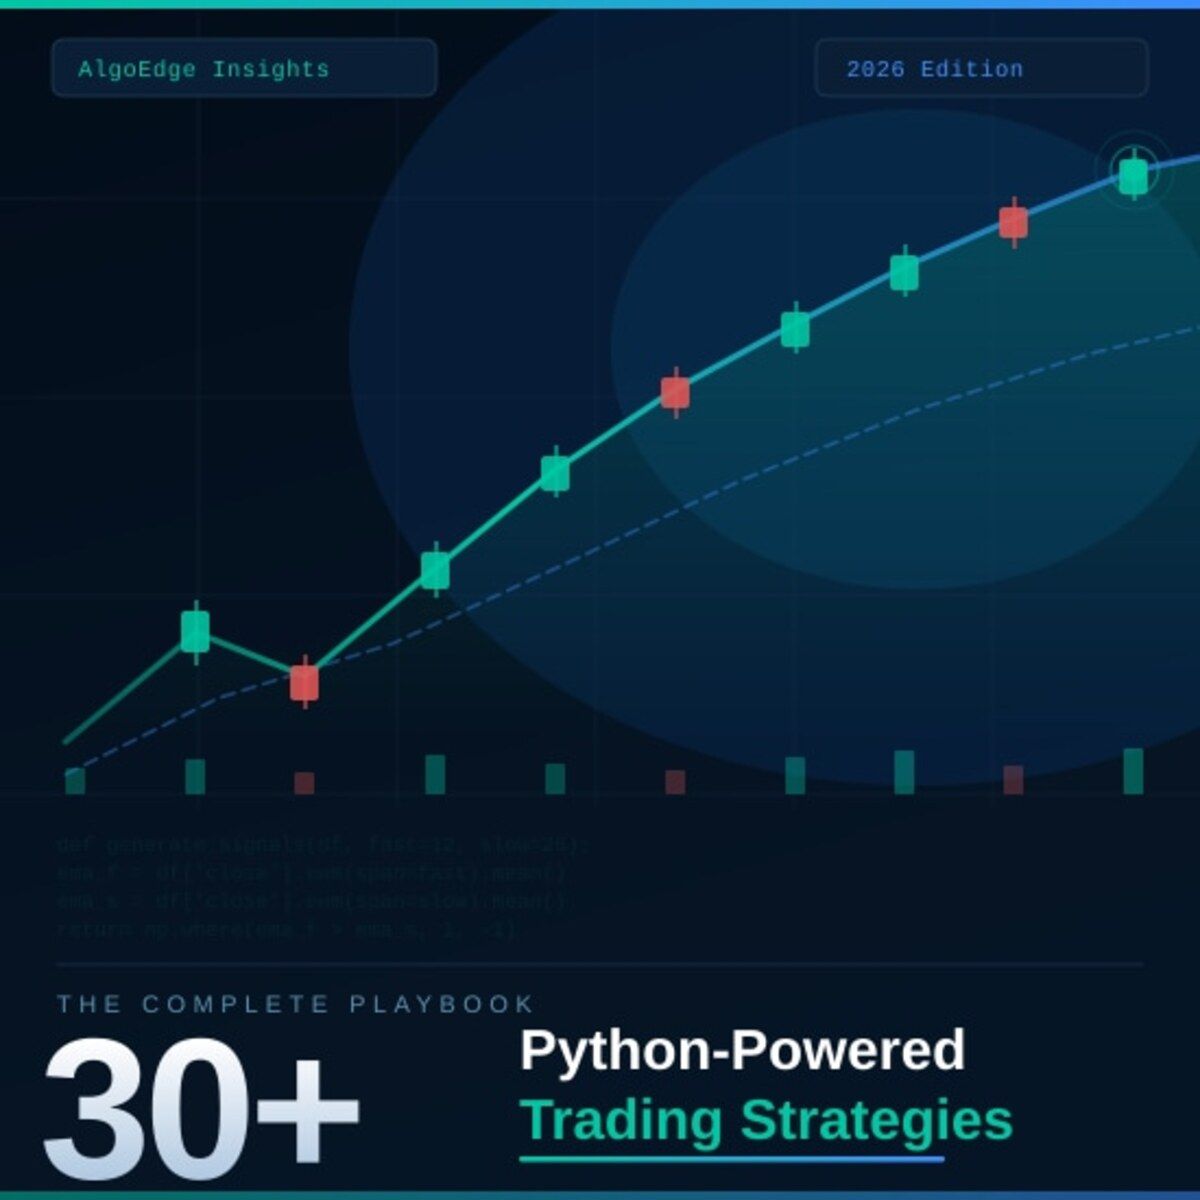
② One strategy in this book returned 2.3× the S&P 500 on a risk-adjusted basis over 5 years.
Fully coded in Python. Yours to run today.
The 2026 Playbook — 30+ backtested strategies,
full code included, ready to deploy.
20% off until Thursday. Use MAY2026 at checkout.
$79 → $63.20 · Expires May 28.
→ Grab it before Tuesday
⑤ Most quant courses teach you to watch. This one makes you build.
Live. Weekly. With feedback on your actual code.
The AlgoEdge Quant Finance Bootcamp — 12 weeks of stochastic models, Black-Scholes, Heston, volatility surfaces, and exotic options. Built from scratch in Python.
Not pre-recorded. Not self-paced. Live sessions, weekly homework, direct feedback, and a full code library that's yours to keep.
Cohort size is limited intentionally — so every question gets answered.
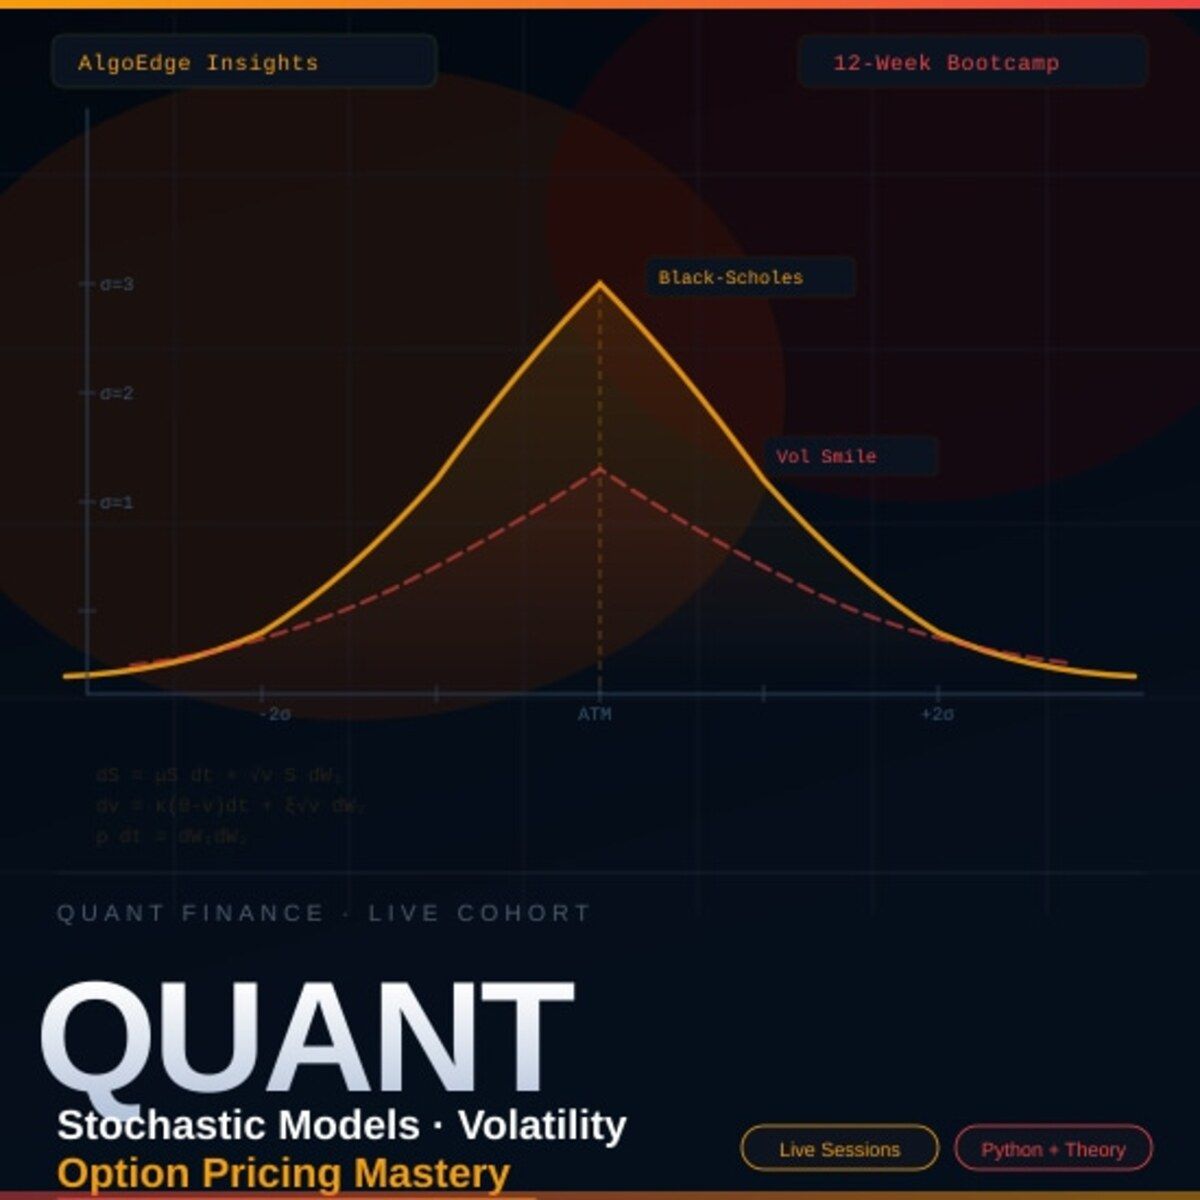
→ Before you enroll, reach out for a 15-minute fit check. No pitch, no pressure.
📩 Email first: [email protected]
Premium Members – Your Full Notebook Is Ready
The complete Google Colab notebook from today’s article (with live data, full Hidden Markov Model, interactive charts, statistics, and one-click CSV export) is waiting for you.
Preview of what you’ll get:

Inside the Strategy Lab
Section 2 — Markov property explained with a hand-drawn state transition diagram (built in matplotlib) showing Bull/Bear/Sideways nodes with illustrative transition probabilities — no external image needed
Section 3 —
define_market_states()with rolling return thresholds, SPY price scatter plot coloured by regime, andestimate_transition_matrix()with a clean heatmap showing persistence on the diagonalSection 4 — Chapman-Kolmogorov multi-step forecasting via
np.linalg.matrix_power, a convergence fan chart showing all starting states collapsing to the stationary distribution, and thefind_stationary_distribution()solver with a bar chart outputSection 5 —
compute_trading_signal()converting probabilities to positions, full walk-forward backtest with daily P re-estimation, three-panel chart (equity curves, drawdown, position over time), rolling 6-month SharpeSection 6 — Complete
MarkovChainTradingSystemclass packaging all components into a clean API with one-line executionSection 7 —
fit_market_hmm()with multi-start Baum-Welch (10 random seeds, keeps best log-likelihood), posterior probability fan chart,hmm_signal()with rolling-window inference, and a three-way comparison chart (Observable Markov vs HMM vs Buy & Hold)Section 8 — Data sufficiency checker (flags any transition with fewer than 20 observations), window sensitivity analysis across 63/126/252/504-day lookbacks, and a critical assumptions table
Free readers – you already got the full breakdown and visuals in the article. Paid members – you get the actual tool.
Not upgraded yet? Fix that in 10 seconds here👇