
In partnership with

The boring Bitcoin strategy that works

Imagine it's 2031. Markets have been chaotic for years. Your coworkers are stressed. You're not. Because five years ago, you did something boring. You opened YieldClub, turned on Autopilot, and your yield started converting into Bitcoin every day. Quietly. Automatically. YieldClub earns up to 12% APY and routes your yield into Bitcoin automatically. No lockups, no guesswork.
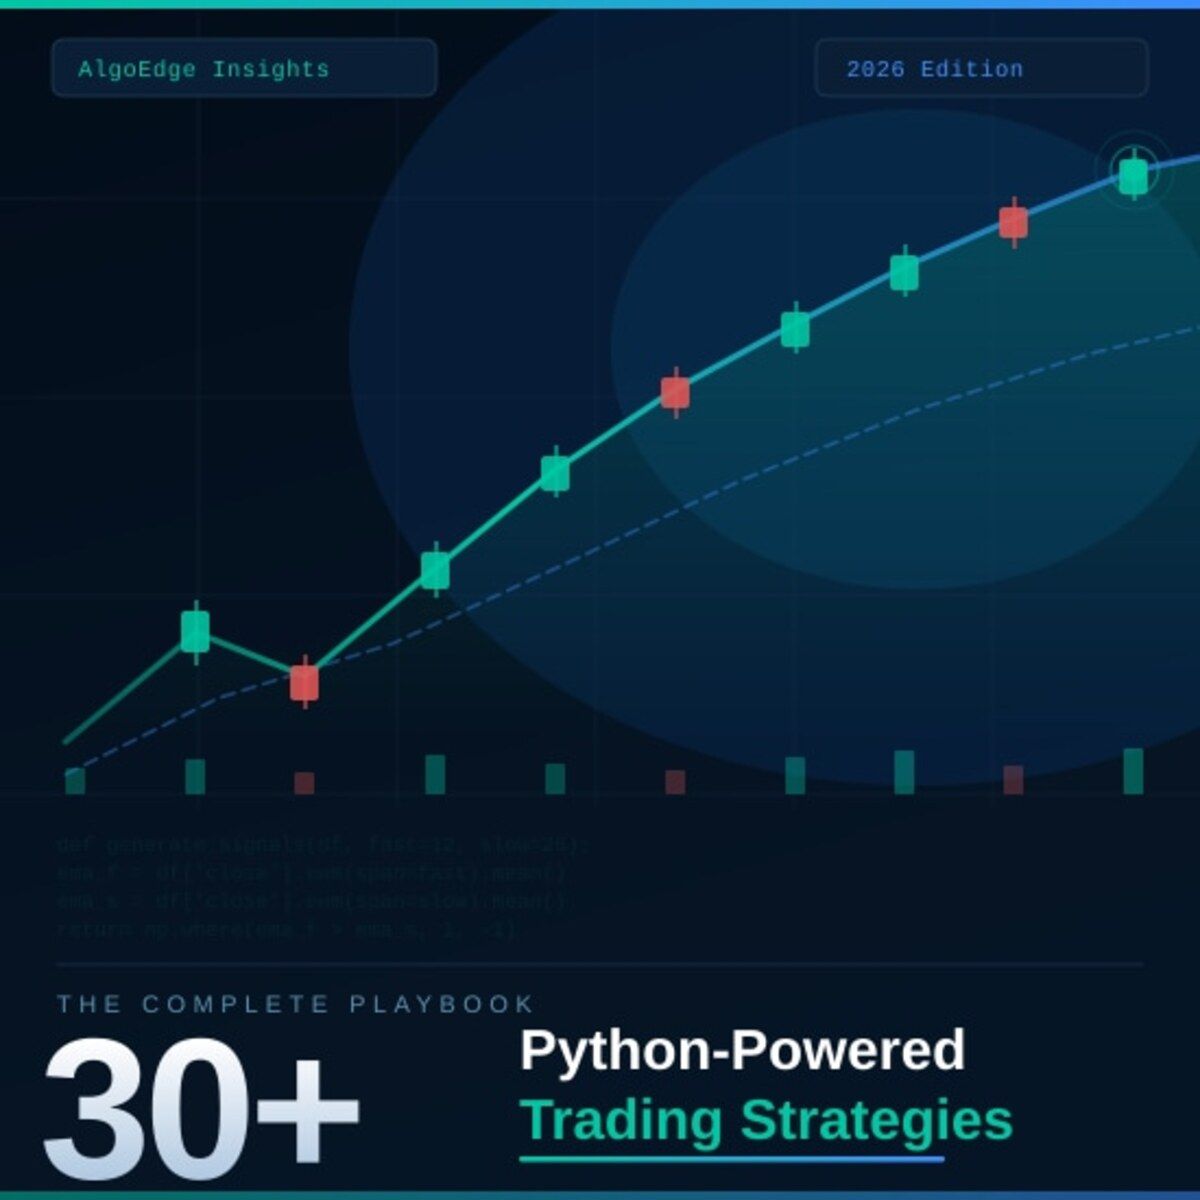
② One strategy in this book returned 2.3× the S&P 500 on a risk-adjusted basis over 5 years.
Fully coded in Python. Yours to run today.
The 2026 Playbook — 30+ backtested strategies,
full code included, ready to deploy.
20% off until Thursday. Use APRIL2026 at checkout.
$79 → $63.20 · Expires April 30.
→ Grab it before Tuesday
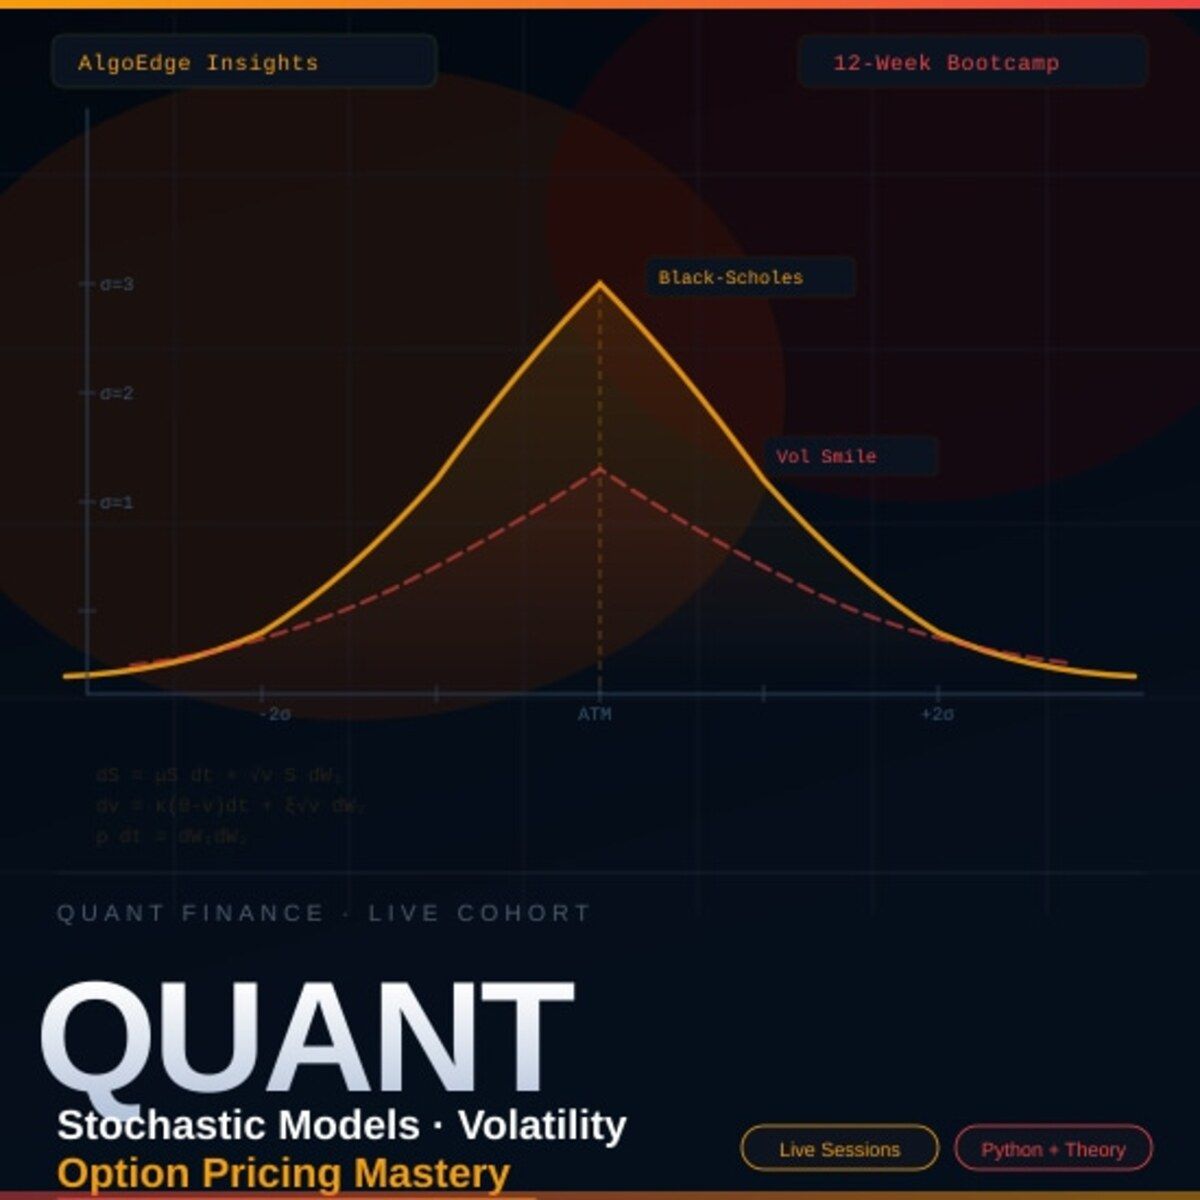
⑤ Most quant courses teach you to watch. This one makes you build.
Live. Weekly. With feedback on your actual code.
The AlgoEdge Quant Finance Bootcamp — 12 weeks of stochastic models, Black-Scholes, Heston, volatility surfaces, and exotic options. Built from scratch in Python.
Not pre-recorded. Not self-paced. Live sessions, weekly homework, direct feedback, and a full code library that's yours to keep.
Cohort size is limited intentionally — so every question gets answered.
→ Before you enroll, reach out for a 15-minute fit check. No pitch, no pressure.
📩 Email first: [email protected]
Premium Members – Your Full Notebook Is Ready
The complete Google Colab notebook from today’s article (with live data, full Hidden Markov Model, interactive charts, statistics, and one-click CSV export) is waiting for you.
Preview of what you’ll get:

Inside the Strategy Lab
Imports Libraries: The notebook imports
numpy,pandas,plotly.express, andalpha_vantagefor data manipulation, visualization, and financial data retrieval.User Input for Ticker: It prompts the user to input a stock ticker symbol.
Alpha Vantage API Integration: It sets up an Alpha Vantage API connection (requires an API key) to fetch financial data.
Fetches Annual Financial Data: It retrieves annual income statements, balance sheets, and cash flow statements for the specified ticker.
Data Cleaning: It cleans the fetched financial data by replacing 'None' values with
NaNand then filling missing values using a backfill method.Financial Ratio Definitions: The notebook defines several Python functions to calculate key financial ratios such as Net Income, Return on Assets (ROA), Operating Cash Flow (OCF), Long-Term Debt change, Current Ratio change, New Shares, Gross Margin change, and Asset Turnover Ratio change.
Piotroski F-Score Calculation: A core function
get_piotroski_scoreis defined, which utilizes the calculated financial ratios to compute the Piotroski F-Score for a given company.Displays Piotroski F-Score: It prints the calculated Piotroski F-Score for the ticker provided by the user.
Predefined Ticker Scores: The notebook includes a hardcoded list of several tickers and their corresponding Piotroski F-Scores.
Piotroski F-Score Visualization: It generates a bar chart using
plotly.expressto visually compare the Piotroski F-Scores of these predefined tickers.
Free readers – you already got the full breakdown and visuals in the article. Paid members – you get the actual tool.
Not upgraded yet? Fix that in 10 seconds here👇