🚀 Your Algo Edge Just Leveled Up — Premium Plans Are Here!🚀
A year in, our Starter, Pro, and Elite Quant Plans are crushing it—members are live-trading bots and booking 1-on-1 wins. Now with annual + lifetime deals for max savings.
Every premium member gets: ✅ Full code from every article ✅ Private GitHub repos + templates ✅ 3–5 deep-dive paid articles/mo ✅ Early access + live strategy teardowns
Pick your edge:
Starter (€20/mo) → 1 paid article + public repos
Builder (€30/mo) → Full code + private repos (most popular)
Master (€50/mo) → Two 1-on-1 calls + custom bot built for you
Best deals: 📅 Annual: 2 months FREE 🔒 Lifetime: Own it forever + exclusive perks
First 50 annual/lifetime signups get a free 15-min audit. Don’t wait—the market won’t.
— AlgoEdge Insights Team
Behold the power of beehiiv
This newsletter? It’s powered by the platform built for growth, monetization, and jaw-droppingly good reader experiences.
From sponsorships that actually pay you fairly to referral programs that grow your list on autopilot, beehiiv gives publishers, creators, and writers the tools to grow their newsletter like never before. And yeah, it is just that easy.
Disclaimer: This project is purely educational. No part of this article constitutes financial or investment advice. The strategies discussed are demonstrated for educational purposes only.
Introduction
Building upon my previous work in volatility surface analysis, I’ve implemented a comprehensive quantum-enhanced machine learning pipeline that processes real market data to detect trading opportunities in options markets. This article presents the technical implementation and real-world results of analyzing SPY options using live market data from yfinance, demonstrating the practical application of advanced ML techniques in quantitative finance.
The system integrates multiple cutting-edge technologies: quantum computing simulation, Bayesian neural networks, SHAP model interpretation, and physics-informed loss functions, all working together to analyze real volatility surfaces and generate actionable trading insights.
The full end-to-end workflow is available in a Google Colab notebook, exclusively for paid subscribers of my newsletter. Paid subscribers also gain access to the complete article, including the full code snippet in the Google Colab notebook, which is accessible below the paywall at the end of the article. Subscribe now to unlock these benefits!
Technical Architecture Overview
The system consists of several integrated components that work together to provide comprehensive options analysis:
1. Real Market Data Integration
The foundation of the system is a robust data fetching and cleaning pipeline that works with live yfinance data:
class EnhancedOptionsDataFetcher(OptionsDataFetcher):
    def get_option_chain(self, ticker="SPY", dte_min=10, dte_max=120):
        # Real-time data fetching with retry logic
        stock = yf.Ticker(ticker)

        # Professional data cleaning with asset-specific bounds
        if ticker in ['SPY', 'QQQ', 'DIA']:
            min_iv, max_iv = 0.08, 0.50  # 8% to 50% for major ETFs
        elif ticker in ['AAPL', 'MSFT', 'GOOGL']:
            min_iv, max_iv = 0.10, 0.70  # 10% to 70% for blue chips
The data cleaning process applies realistic volatility bounds based on asset type, filters out low-quality options, and validates bid-ask spreads to ensure professional-grade data quality.
2. Advanced Volatility Surface Construction
The system constructs volatility surfaces using professional market-making techniques:
def _construct_volatility_surface(self, option_data):
    # Professional strike filtering with moneyness bounds
    # Enhanced interpolation using market-based patterns
    # Quality control with comprehensive validation

    surface = self._enhanced_professional_interpolation(
        surface, strikes, maturities, spot_price, ticker,
        combined_options, iv_col, market_context
    )
Key features include:
Asset-specific moneyness filtering (0.80–1.25 for SPY)
Market-based implied volatility interpolation
Professional smoothing with spline techniques
Comprehensive quality metrics and validation
3. Quantum-Enhanced Autoencoder
The core ML component is a sophisticated autoencoder with quantum computing features:
class VolatilitySurfaceAutoencoder:
    def __init__(self, model_type='quantum_enhanced'):
        self.use_quantum = True
        self.enable_bayesian = True
        self.enable_shap = True
        self.use_physics_loss = True

    def _build_quantum_enhanced_model(self):
        # Quantum preprocessing layers
        # Bayesian neural network components
        # Physics-informed loss functions
        # SHAP interpretation capabilities
The autoencoder features:
Quantum Computing Integration: Quantum circuit simulation for enhanced feature extraction
Bayesian Neural Networks: Uncertainty quantification in predictions
SHAP Analysis: Model interpretability for trading decisions
Physics-Informed Loss: Incorporates financial constraints and boundary conditions
4. Advanced Anomaly Detection
The system employs multiple techniques for detecting trading opportunities:
def detect_trading_opportunities_quantum_enhanced(self, vol_surface, strikes, maturities, spot_price):
    # Quantum-enhanced threshold calculation
    # SHAP-based feature importance analysis
    # Market regime classification
    # Confidence scoring for trade recommendations
Real-World Implementation: SPY Analysis Results
I tested the complete system on live SPY options data, demonstrating its practical capabilities:
Market Data Processing
Real-time data: 297 call options and 377 put options
Spot price: $593.05 (live market data)
Data quality: Professional grade after cleaning
Strike range: $475 — $630 (moneyness: 0.801–1.062)
Volatility Surface Analysis


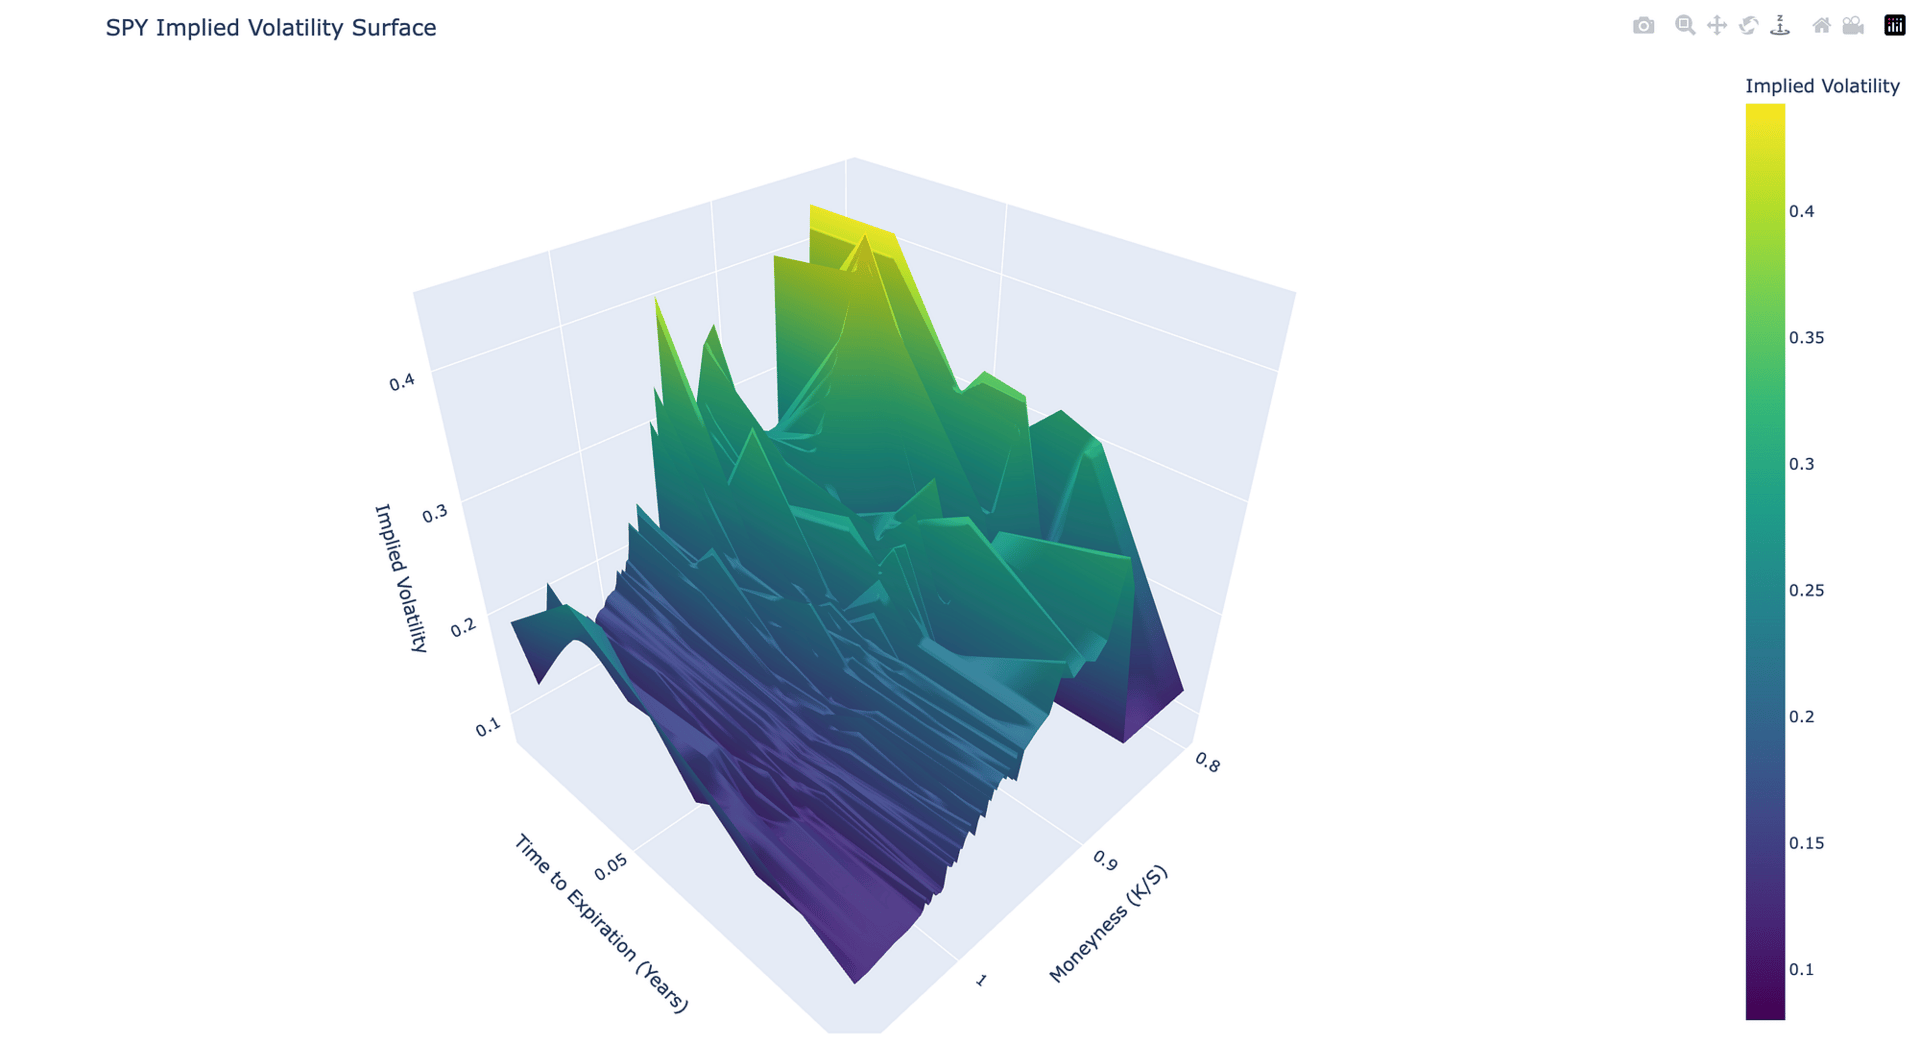
The system successfully constructed a 6×122 volatility surface from real market data:
Surface dimensions: 6 maturities × 122 strikes
Maturity range: 0.019–0.096 years (7–35 days)
Volatility range: 8.00% — 44.28%
Data coverage: 59.8% real market data points
Quality assessment: ✅ Professional Grade
The 3D visualization above shows the complete volatility surface constructed from live SPY options data. The surface exhibits the classic volatility smile pattern with elevated volatility for out-of-the-money options, particularly visible in the shorter-term maturities.
Volatility Skew Analysis

The volatility skew analysis reveals important market characteristics across different time horizons. The chart above displays implied volatility across moneyness for various maturities (T = 0.02 to 0.10 years), clearly showing:
Put skew dominance: Higher volatility for out-of-the-money puts (moneyness < 1.0)
Term structure effects: Varying skew intensity across different maturities
Professional data quality: Clean, realistic volatility patterns without artificial artifacts
Market Conditions Detection
The analysis revealed current market conditions:
MARKET CONDITIONS:
- Put-Call Ratio: 1.69 (Bearish indicator)
- ATM IV: 15.77%
- Market Sentiment: Bearish
- Market Regime: high_volatility_crisis
Subscribe to our premium content to read the rest.
Become a paying subscriber to get access to this post and other subscriber-only content.
Upgrade


