
In partnership with

Q1 2026: $20.8B in BDC Redemption Requests. 0.44% Lifetime Net Loss Rate on Percent.

In Q1 2026, the non-traded BDC market hit $20.8B in redemption requests — most investors received roughly half of what they asked for. Moody's revised the U.S. BDC sector outlook to Negative. Investors who thought they owned liquid private credit found out their fund manager decided whether they could get out.
On Percent's marketplace that same quarter: new issuances, scheduled payments, and a 0.44% lifetime net loss rate on asset-based deals that's held since inception.†
The difference is structural. BDCs often own concentrated corporate loans with quarterly redemption windows that close at the manager's discretion. Percent finances specialty lenders against pools of performing receivables — diversified, overcollateralized, short duration.
Track record through 3/31/26:†
14.6% net ABS returns LTM after losses
0.44% lifetime net loss rate since inception (asset-based deals)
$1.62B+ in ABS originations
870+ offerings completed
Deal terms 6–24 months · Starting at $500
Alternative investments are speculative. No assurance can be given that investors will receive a return of their capital. Secondary market transactions are subject to availability and issuer approval; liquidity is not guaranteed. †Past performance is not indicative of future results. Terms apply.
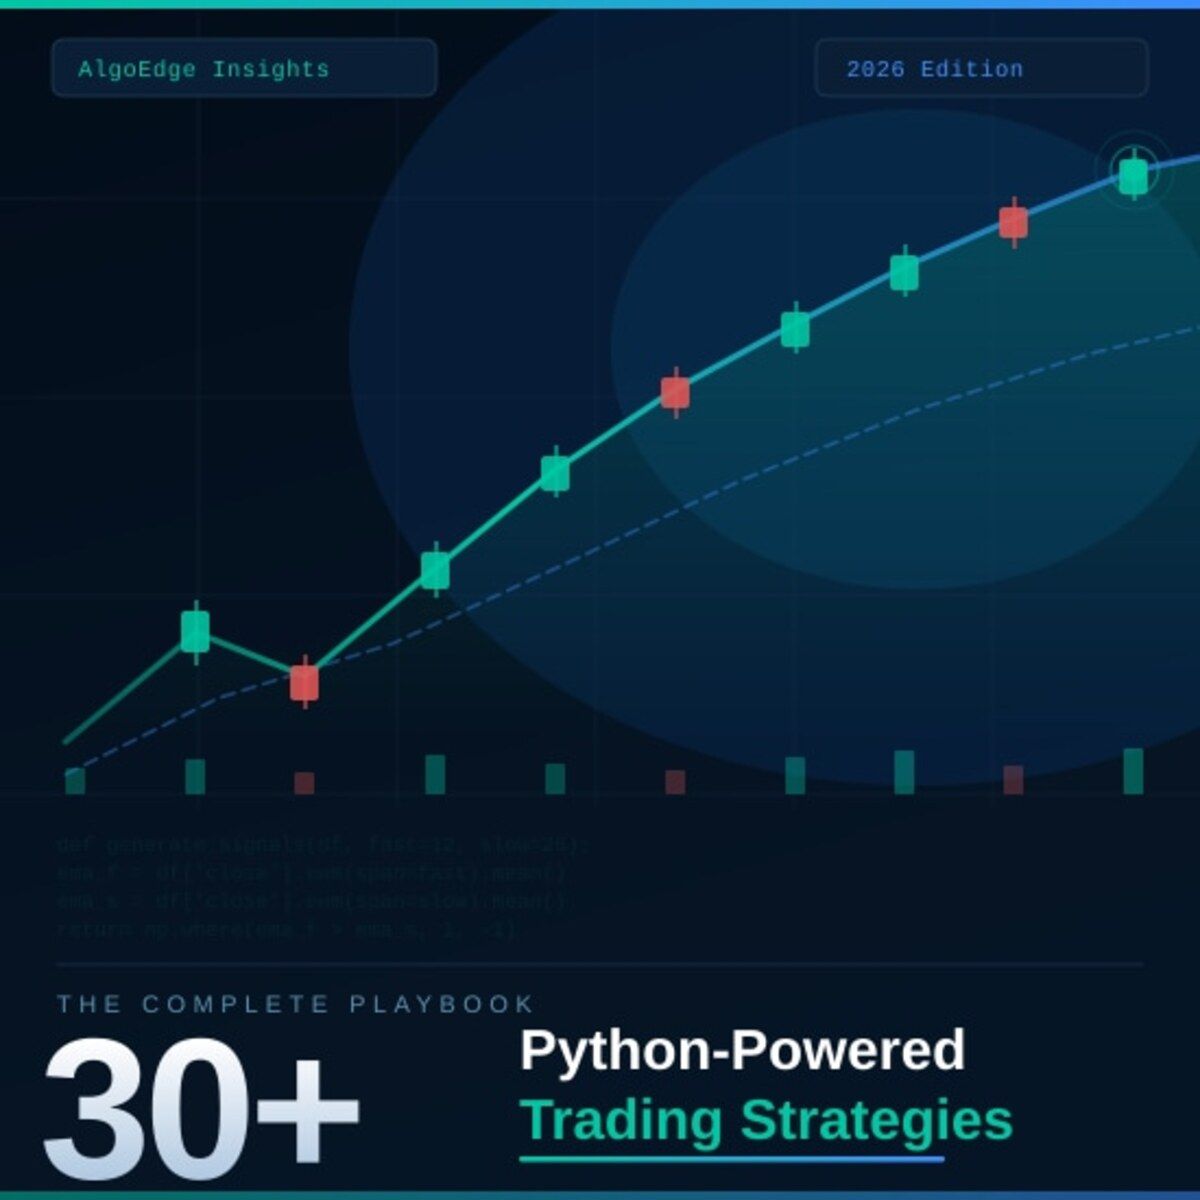
② One strategy in this book returned 2.3× the S&P 500 on a risk-adjusted basis over 5 years.
Fully coded in Python. Yours to run today.
The 2026 Playbook — 30+ backtested strategies,
full code included, ready to deploy.
20% off until Thursday. Use MAY2026 at checkout.
$79 → $63.20 · Expires May 21.
→ Grab it before Tuesday
⑤ Most quant courses teach you to watch. This one makes you build.
Live. Weekly. With feedback on your actual code.
The AlgoEdge Quant Finance Bootcamp — 12 weeks of stochastic models, Black-Scholes, Heston, volatility surfaces, and exotic options. Built from scratch in Python.
Not pre-recorded. Not self-paced. Live sessions, weekly homework, direct feedback, and a full code library that's yours to keep.
Cohort size is limited intentionally — so every question gets answered.
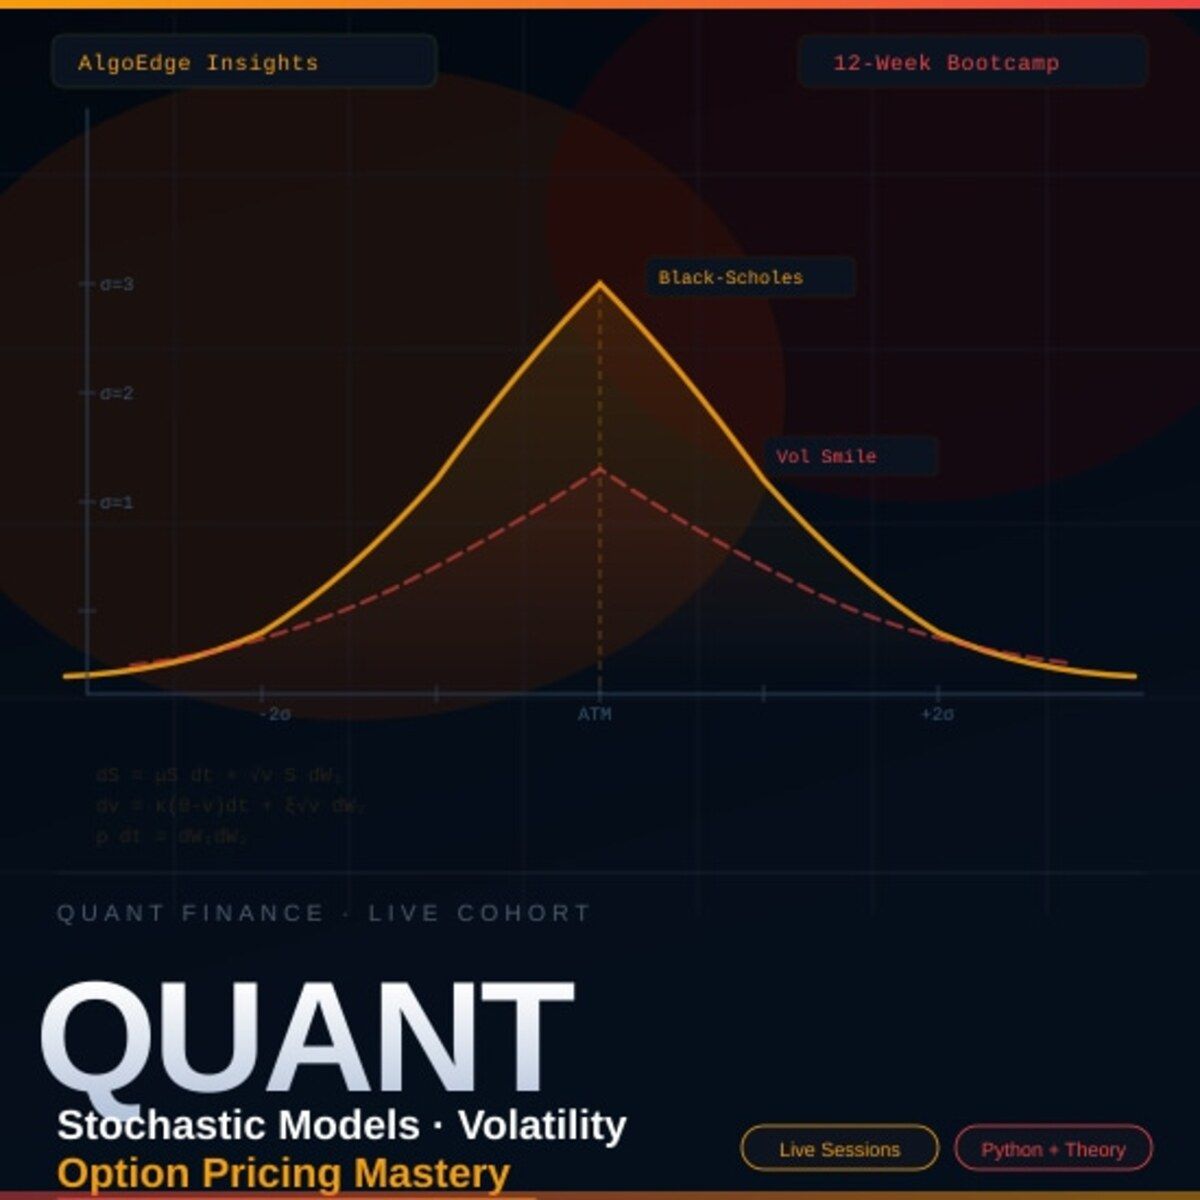
→ Before you enroll, reach out for a 15-minute fit check. No pitch, no pressure.
📩 Email first: [email protected]
Premium Members – Your Full Notebook Is Ready
The complete Google Colab notebook from today’s article (with live data, full Hidden Markov Model, interactive charts, statistics, and one-click CSV export) is waiting for you.
Preview of what you’ll get:

Inside the Strategy Lab
Section 2 — Synthetic IV surface generator producing a realistic 7×5 moneyness-tenor grid (1260 days) with smile, term structure, and injected FOMC/NFP/CPI event jumps baked in — swap in your own data by replacing
iv_surfaceSection 3 — PCA on daily ΔIV changes (not levels), scree plot, factor time series, and per-factor loadings heatmaps showing how each grid point responds to Level / Slope / Curvature
Section 4 — VAR(5) fit on the 3 factors, residual volatility clustering plots justifying GARCH, and GARCH(1,1) fit on each factor residual with persistence diagnostics
Section 5 — Markov regime-switching model on PC1 with smoothed regime probability fan chart, regime-conditional volatility stats, and a note on why VVIX outperforms VIX for regime detection
Section 6 — Full event schedule generator (FOMC/NFP/CPI/quarterly expiry), TTE normalisation, event variance decomposition, TTE feature correlation with PC1, and VAR re-fit with exogenous TTE regressors showing AIC/BIC improvement
Section 7 — Monte Carlo simulation function with GARCH-evolving conditional variances and Cholesky-correlated innovations, fan chart of ATM 1M IV paths, and simulated surface distribution across all tenors at the forecast horizon
Section 8 — Portfolio VaR/CVaR from simulated paths, P&L histogram, and a FOMC surprise scenario (3σ PC1 shock on day 10) showing baseline vs. shocked surface divergence
Section 9 — Walk-forward validation with weekly re-fitting, MAE/RMSE/correlation metrics per factor, and predicted-vs-actual plots
Free readers – you already got the full breakdown and visuals in the article. Paid members – you get the actual tool.
Not upgraded yet? Fix that in 10 seconds here👇