Crash Expert: “This Looks Like 1929” → 70,000 Hedging Here
Mark Spitznagel, who made $1B in a single day during the 2015 flash crash, warns markets are mimicking 1929. Yeah, just another oracle spouting gloom and doom, right?
Vanguard and Goldman Sachs forecast just 5% and 3% annual S&P returns respectively for the next decade (2024-2034).
Bonds? Not much better.
Enough warning signals—what’s something investors can actually do to diversify this week?
Almost no one knows this, but postwar and contemporary art appreciated 11.2% annually with near-zero correlation to equities from 1995–2024, according to Masterworks Data.
And sure… billionaires like Bezos and Gates can make headlines at auction, but what about the rest of us?
Masterworks makes it possible to invest in legendary artworks by Banksy, Basquiat, Picasso, and more – without spending millions.
23 exits. Net annualized returns like 17.6%, 17.8%, and 21.5%. $1.2 billion invested.
Shares in new offerings can sell quickly but…
*Past performance is not indicative of future returns. Important Reg A disclosures: masterworks.com/cd.
🚀 Your Algo Edge Just Leveled Up — Premium Plans Are Here!🚀
A year in, our Starter, Pro, and Elite Quant Plans are crushing it—members are live-trading bots and booking 1-on-1 wins. Now with annual + lifetime deals for max savings.
Every premium member gets: ✅ Full code from every article ✅ Private GitHub repos + templates ✅ 3–5 deep-dive paid articles/mo ✅ Early access + live strategy teardowns
Pick your edge:
Starter (€20/mo) → 1 paid article + public repos
Builder (€30/mo) → Full code + private repos (most popular)
Master (€50/mo) → Two 1-on-1 calls + custom bot built for you
Best deals: 📅 Annual: 2 months FREE 🔒 Lifetime: Own it forever + exclusive perks
First 50 annual/lifetime signups get a free 15-min audit. Don’t wait—the market won’t.
— AlgoEdge Insights Team
The Triple Barrier Method, described by Marco Lopez de Prado in Advances in Financial Machine Learning, is a powerful technique for labeling events based on price movements. It mirrors real-world trading, where take-profits and stop-losses influence decisions — even implicitly, as in the case of margin calls. By defining three barriers — an upper barrier (profit-taking level), a lower barrier (stop-loss level), and a vertical barrier (time-based exit) — this method provides a structured framework for identifying meaningful price actions.
In this blog post, we’ll explore the intuition behind the method and demonstrate its implementation in Python for tick-level data. Note: This data will likely not fit in memory, but we’ll cover strategies for handling such large datasets in a future post. I personally use a custom + Dask solution which I can cover if enough people are interested.
How It Works
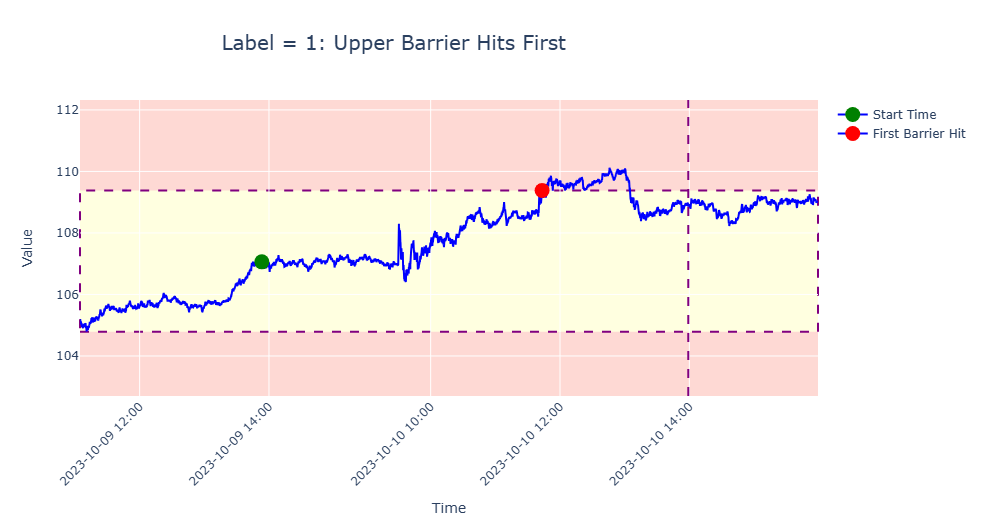
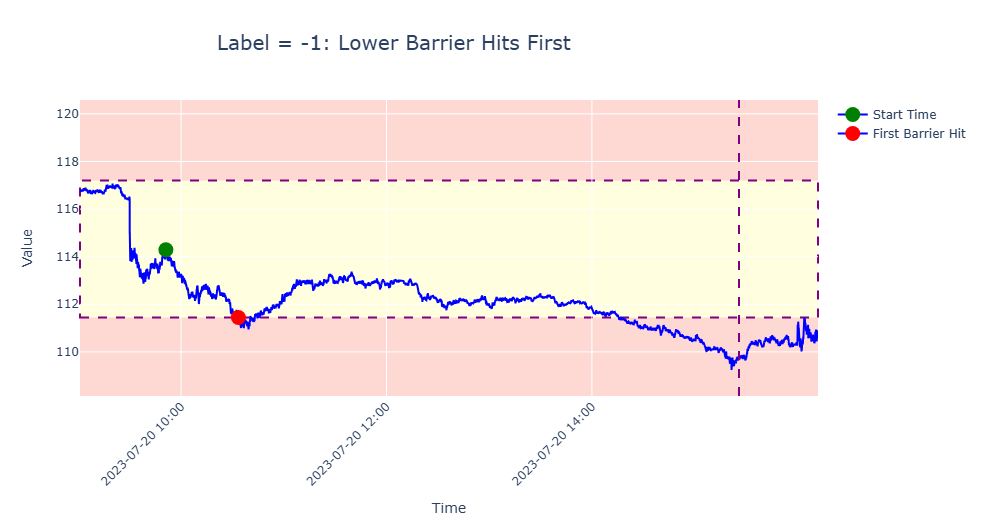
Upper Barrier:
Set above the initial price. If the price hits this level first, the label is 1.Lower Barrier:
Set below the initial price. If the price hits this level first, the label is -1.Vertical Barrier:
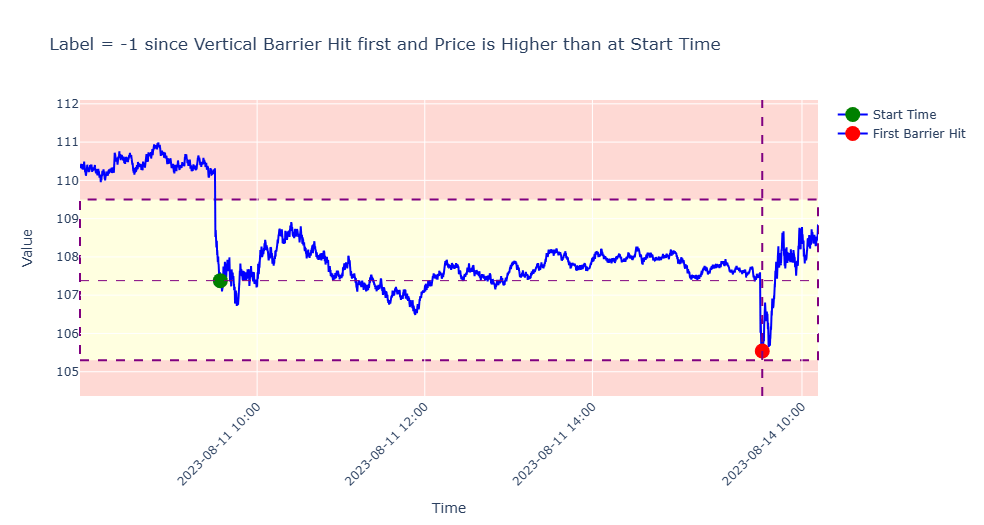
If neither horizontal barrier is reached within a predefined time frame, the label depends on the price at the exit:
1 if the exit price is above the event’s start price.
-1 if the exit price is at or below the event’s start price.
(Alternative: Some use a neutral label (0) for time-based exits but assigning 1 or -1 and incorporating sample weights often yields better results, as we’ll discuss in a later post.)
Examples


Setting Barrier Widths
Vertical Barrier
The vertical barrier is a time-based exit. While Lopez de Prado suggests setting it a fixed number of days after the event, this approach doesn’t account for nuances like business days, half-days, or specific trading hours. A better alternative is to define it as a fixed number of bars (e.g., volume bars, time bars, or dollar bars). For instance:
Set the vertical barrier to 50 bars after the event’s start time.
Horizontal Barriers
Horizontal barriers depend on price volatility. A common approach is to compute a rolling exponential weighted standard deviation (EWMA) of log returns over a fixed period. For example:
Calculate the EWMA standard deviation, σₜ, of 50-period log returns with a 100-bar window.
Compute barriers:
Upper Barrier: Pₜ⋅exp(C⋅σₜ)
Lower Barrier: Pₜ⋅exp(-Cσₜ)
where Pₜ is the current price and C is a configurable constant to control barrier width
Python Implementation
Assume we have dollar bars in a dataframe df_dollar_bars and trade level data in a dataframe df with columns Price, Size and index timestamp.
Add Barriers to Dollar Bars
C = 1
df_dollar_bars['Close_shift']=df_dollar_bars.Close.shift(50)
df_dollar_bars['Vertical_Barrier_TS']=df_dollar_bars.START_TS.shift(-50)
df_dollar_bars['std']=np.log(df_dollar_bars['Close']/df_dollar_bars['Close_shift']).ewm(100,min_periods=100).std()
df_dollar_bars['Upper_Barrier']=df_dollar_bars['Close']*np.exp(C*df_dollar_bars['std'])
df_dollar_bars['Lower_Barrier']=df_dollar_bars['Close']*np.exp(-C*df_dollar_bars['std'])
Label Events
def get_labels(df,dollar_bars,events):
    dollar_bars_events = dollar_bars.loc[events]
    first_barrier_touch_times = []
    for index,row in dollar_bars_events.iterrows():
        vertical_barrier = row['Vertical_Barrier_TS']
        prices =  df.loc[index:vertical_barrier].price
        upper_barrier_first_touch=prices[prices>row['Upper_Barrier']].index.min()
        lower_barrier_first_touch=prices[prices<row['Lower_Barrier']].index.min()
        first_barrier_touch_time=pd.Series([upper_barrier_first_touch,lower_barrier_first_touch,vertical_barrier]).min()
        first_barrier_touch_times.append(first_barrier_touch_time)
    labels = [1 if df.price[end].min()>df.price[start].min() else -1 for start,end in zip(events,first_barrier_touch_times)]
    return labels

labels = get_labels(df,df_dollar_bars,cusum_events)
References
De Prado, M.L. Advances in Financial Machine Learning. Wiley, 2018. Chapter 3 introduces the concept of the Triple Barrier Method and its use in labeling financial data.
GitHub Repository: Explore implementations at Hudson & Thames ML Finlab.
Research Article: Lopez de Prado, M.L. (2018). “The Triple Barrier Method for Labeling.” Available via SSRN: https://ssrn.com/abstract=3328466.


