Most traders use past price movements to estimate future trends. But options already embed those expectations and you can extract them.
Options prices not only reflect volatility. They capture the market’s collective expectations of future prices.
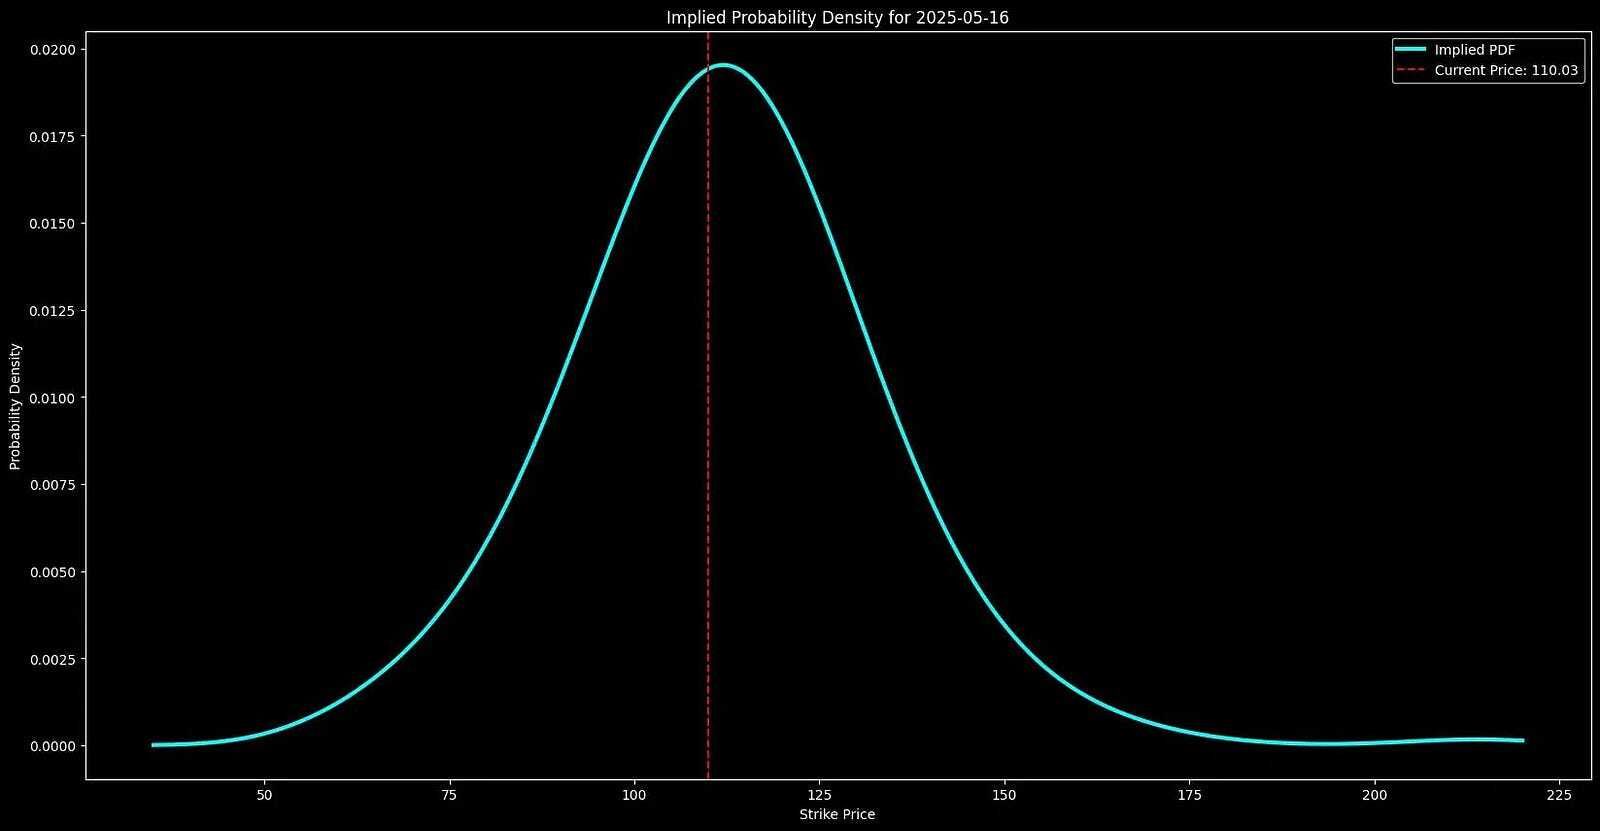
If we analyze option-implied probabilities, we can construct a forward-looking distribution of expected stock prices. We’ll do it in this article.
Specifically, we will construct a forward-looking distribution of expected stock prices based on option-implied probabilities for a given future date.
This approach goes beyond traditional indicators. It shows where traders believe a stock is most likely to end up by a given expiration date.
In this article, we’ll break down the step-by-step process of deriving market-implied probability distributions using options data.
The full end-to-end workflow is available in a Google Colab notebook, exclusively for paid subscribers of my newsletter. Paid subscribers also gain access to the complete article, including the full code snippet in the Google Colab notebook, which is accessible below the paywall at the end of the article. Subscribe now to unlock these benefits!

In this article, we’ll cover:
How to fetch and filter option chain data
Calculating implied volatility using the Black-Scholes model
Applying the Breeden-Litzenberger formula to extract risk-neutral probabilities
Smoothing the probability distribution for better insights
Visualizing a 3D implied probability surface over multiple expirations.
Subscribe to our premium content to read the rest.
Become a paying subscriber to get access to this post and other subscriber-only content.
Upgrade
