
Sponsored by

The Volatility Cone: A Quant's Tool for Mapping Price Uncertainty
How Jennifer Aniston’s LolaVie brand grew sales 40% with CTV ads

The DTC beauty category is crowded. To break through, Jennifer Aniston’s brand LolaVie, worked with Roku Ads Manager to easily set up, test, and optimize CTV ad creatives. The campaign helped drive a big lift in sales and customer growth, helping LolaVie break through in the crowded beauty category.
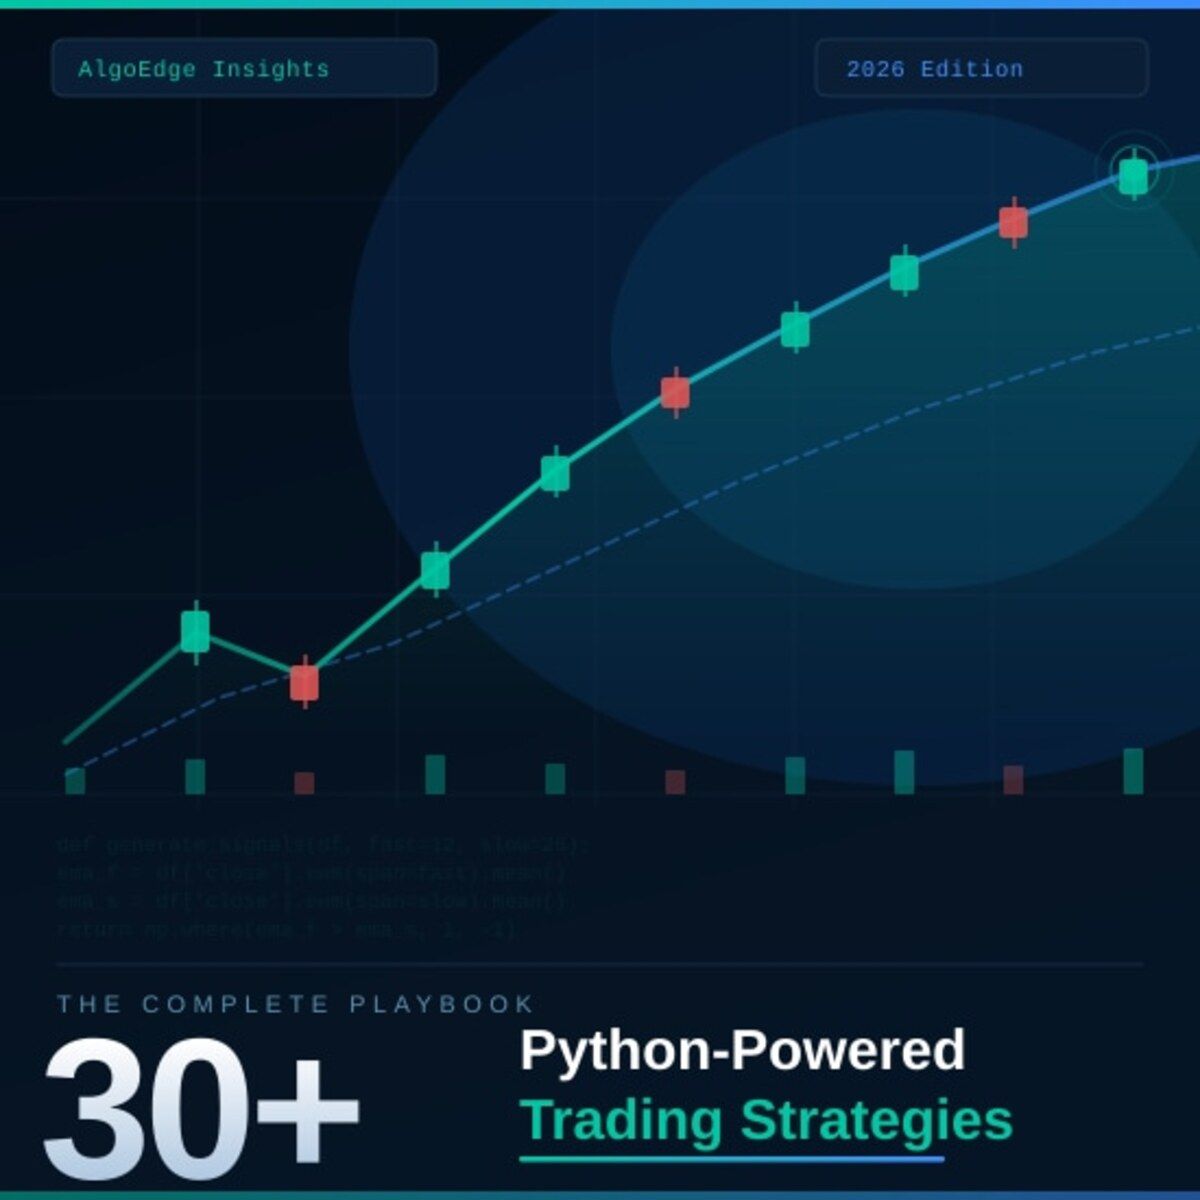
② One strategy in this book returned 2.3× the S&P 500 on a risk-adjusted basis over 5 years.
Fully coded in Python. Yours to run today.
The 2026 Playbook — 30+ backtested strategies,
full code included, ready to deploy.
20% off until Tuesday. Use APRIL2026 at checkout.
$79 → $63.20 · Expires April 7.
→ Grab it before Tuesday
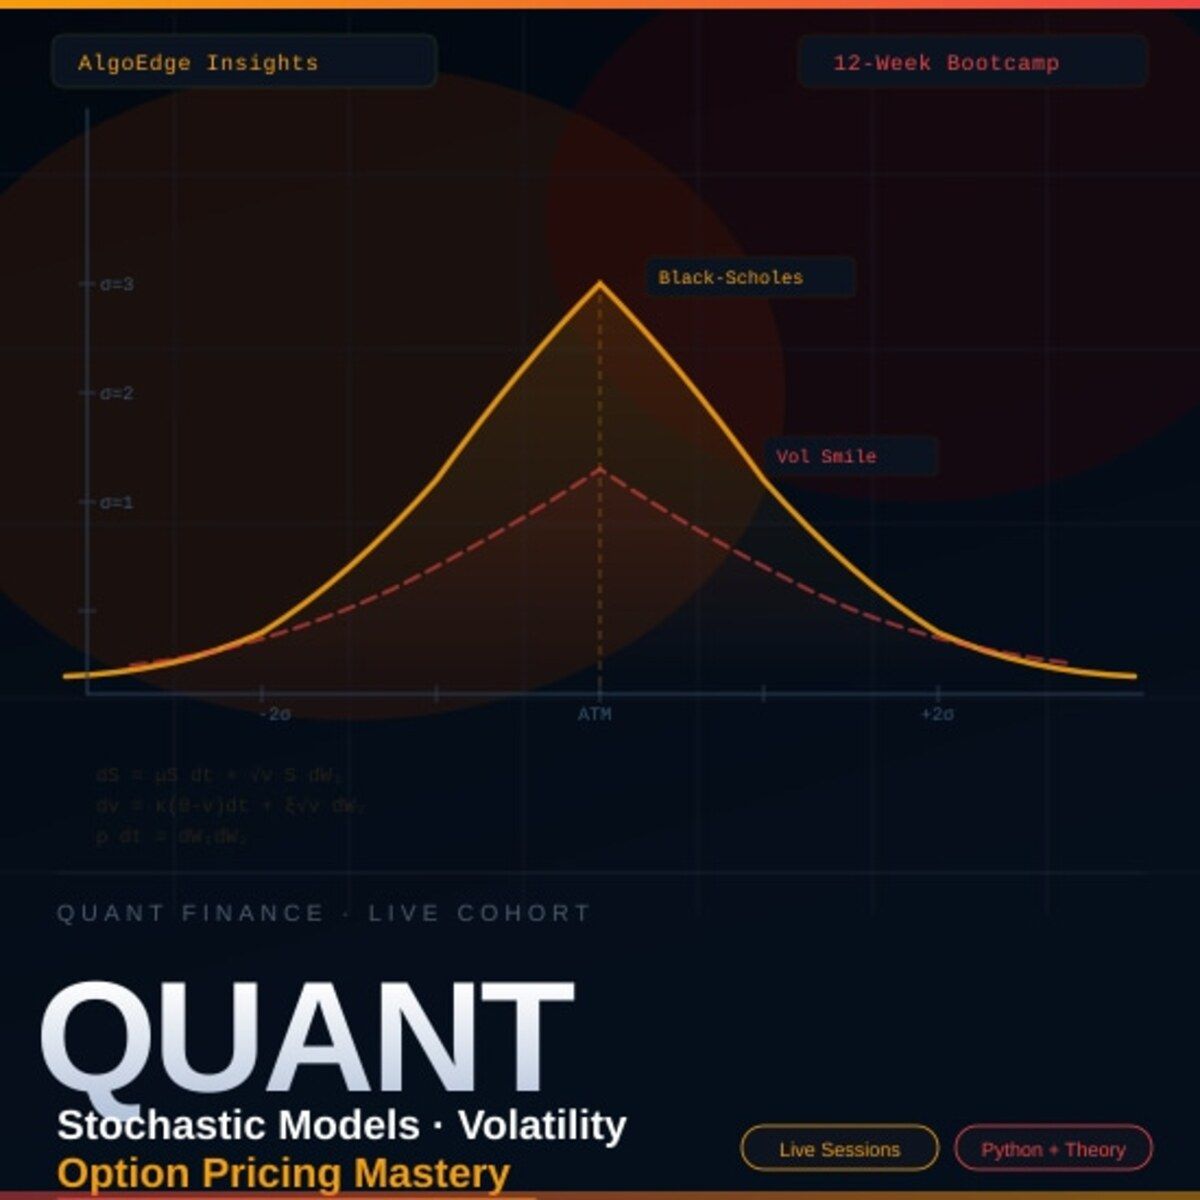
⑤ Most quant courses teach you to watch. This one makes you build.
Live. Weekly. With feedback on your actual code.
The AlgoEdge Quant Finance Bootcamp — 12 weeks of stochastic models, Black-Scholes, Heston, volatility surfaces, and exotic options. Built from scratch in Python.
Not pre-recorded. Not self-paced. Live sessions, weekly homework, direct feedback, and a full code library that's yours to keep.
Cohort size is limited intentionally — so every question gets answered.
→ Before you enroll, reach out for a 15-minute fit check. No pitch, no pressure.
📩 Email first: [email protected]
Premium Members – Your Full Notebook Is Ready
The complete Google Colab notebook from today’s article (with live data, full Hidden Markov Model, interactive charts, statistics, and one-click CSV export) is waiting for you.
Preview of what you’ll get:

Inside the Strategy Lab
📥 Auto-fetches GSPC.INDX data — Integrated with EODHD APIs to pull 10 years of historical daily price action.
📡 Low-Pass Filter Logic — Explains how to separate high-frequency market "noise" from the underlying "signal" using DSP principles.
🛡️ Bias-Free Signal Engine — Implements causal math using
.shift(1)to strictly eliminate lookahead bias and "seeing the future."⚖️ Lag-Length Analysis — Quantifies the trade-off between smoothness and responsiveness ($Lag \approx \frac{N-1}{2}$) across 5 different time horizons.
🔄 Multi-Window Backtester — Runs 10-day, 20-day, 50-day, 100-day, and 200-day Simple Moving Average (SMA) strategies simultaneously.
📊 Risk-Adjusted Scorecard — Calculates Sharpe Ratios, Annualized Volatility, and Max Drawdowns for every window.
📉 Drawdown Heatmaps — Visualizes the peak-to-trough pain for each strategy to identify which window survives market crashes best.
📈 Comparative Visualization — Generates 6+ high-resolution charts, including equity curves, rolling volatility, and performance bar charts.
🗃️ Performance Matrix — Consolidates all results into a clean, rounded
pandastable ready for export or further quantitative research.
Free readers – you already got the full breakdown and visuals in the article. Paid members – you get the actual tool.
Not upgraded yet? Fix that in 10 seconds here👇