
Sponsored by

Learn why a great property doesn’t always make a great deal.

Wharton Online’s Real Estate Investing Certificate Program teaches the same analytical framework used by institutional real estate investors and experienced operators alike.
Get the same hands-on training used at BlackRock, KKR, and other top firms
Earn a globally recognized certificate from a top business school
Collaborate in LIVE office hours with Wharton faculty and investing practitioners from Wall Street Prep
Join the next cohort starting June 8. Use code SAVE300 to get $300 off tuition.
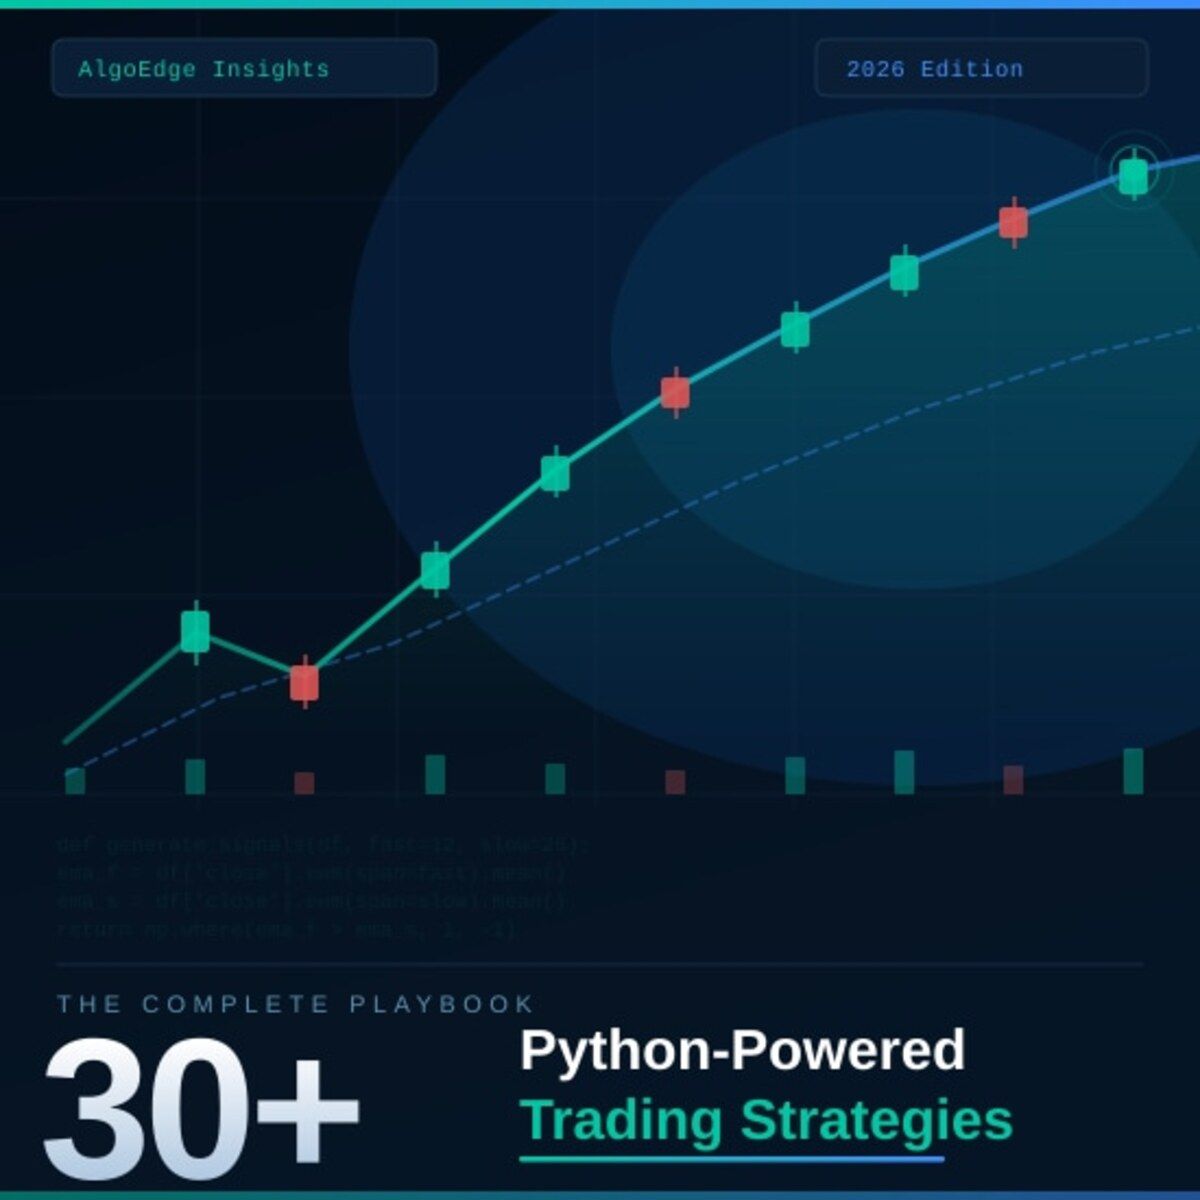
② One strategy in this book returned 2.3× the S&P 500 on a risk-adjusted basis over 5 years.
Fully coded in Python. Yours to run today.
The 2026 Playbook — 30+ backtested strategies,
full code included, ready to deploy.
20% off until Sunday. Use MAY2026 at checkout.
$79 → $63.20 · Expires May 30.
→ Grab it before Tuesday
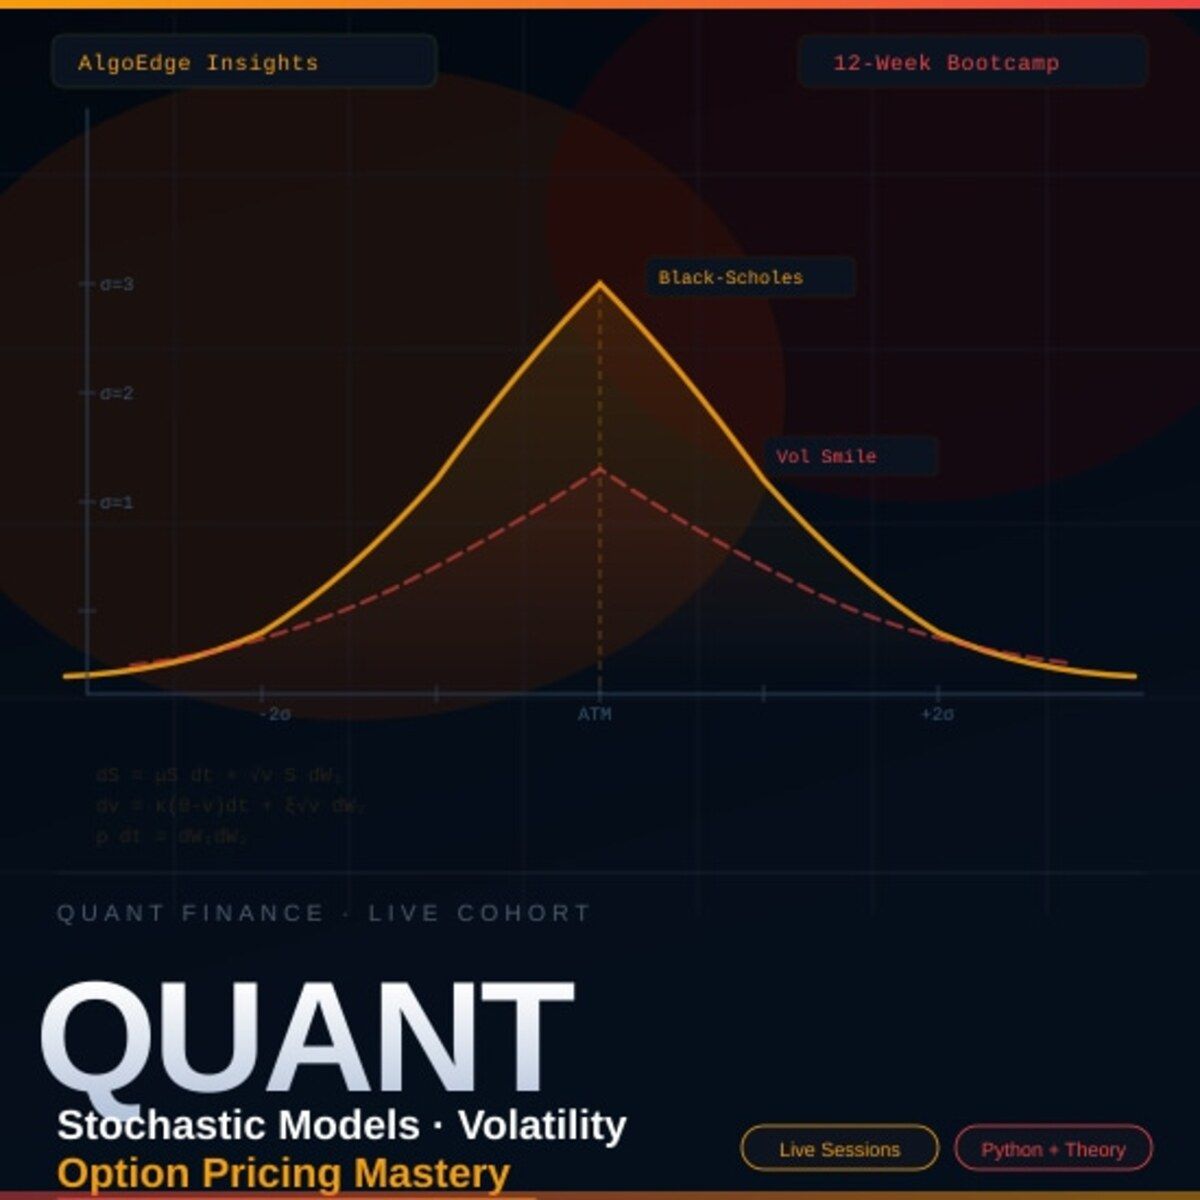
⑤ Most quant courses teach you to watch. This one makes you build.
Live. Weekly. With feedback on your actual code.
The AlgoEdge Quant Finance Bootcamp — 12 weeks of stochastic models, Black-Scholes, Heston, volatility surfaces, and exotic options. Built from scratch in Python.
Not pre-recorded. Not self-paced. Live sessions, weekly homework, direct feedback, and a full code library that's yours to keep.
Cohort size is limited intentionally — so every question gets answered.
→ Before you enroll, reach out for a 15-minute fit check. No pitch, no pressure.
📩 Email first: [email protected]
Premium Members – Your Full Notebook Is Ready
The complete Google Colab notebook from today’s article (with live data, full Hidden Markov Model, interactive charts, statistics, and one-click CSV export) is waiting for you.
Preview of what you’ll get:

Inside the Strategy Lab
Section 2 —
get_historical_data()fetching AAPL from Twelve Data + interactive Plotly OHLC + volume chartSection 3 —
VAMA()function with docstring, VAMA 10/55 overlay on candlestick chart, andVAMACrossstrategy class backtested withbacktesting.pySection 4 —
VAMAOCrossfour-parameter class, grid search optimization with theconstraintlambda, top-3 parameter printout, (n1, n2) heatmap, and the fullplot_heatmaps()panelSection 5 — Full DEAP genetic algorithm pipeline:
eval_strategy, toolbox setup, custommutate_individual, 10-run loop with best-of-runs tracking, GA convergence curve, train-set VAMA overlay, OOS signals with buy/sell markers, equity curve vs buy & hold, and average monthly returns bar chartSection 6 — Granger causality loop across
n ∈ [10,20,30,40,50,60,70], automaticn₀selection (largest n with p < 0.05), bar chart with significance threshold line, andVAMACrossGrangerbacktest using the selected windowSection 7 — All five indicators computed (EMA9, SMA20/50/100, RSI14, Bollinger Bands, ATR14) and rendered in a 4-panel Plotly chart (price + MAs + BB, RSI with overbought/oversold lines, ATR, volume)
Section 8 — Summary comparison table of all four experiments with a grouped bar chart of strategy vs buy-and-hold returns
Free readers – you already got the full breakdown and visuals in the article. Paid members – you get the actual tool.
Not upgraded yet? Fix that in 10 seconds here👇