
In partnership with


If you work in fintech or finance, you already have too many tabs open and not enough time.
Fintech Takes is the free newsletter senior leaders actually read. Each week, I break down the trends, deals, and regulatory moves shaping the industry — and explain why they matter — in plain English.
No filler, no PR spin, and no “insights” you already saw on LinkedIn eight times this week. Just clear analysis and the occasional bad joke to make it go down easier.
Get context you can actually use. Subscribe free and see what’s coming before everyone else.
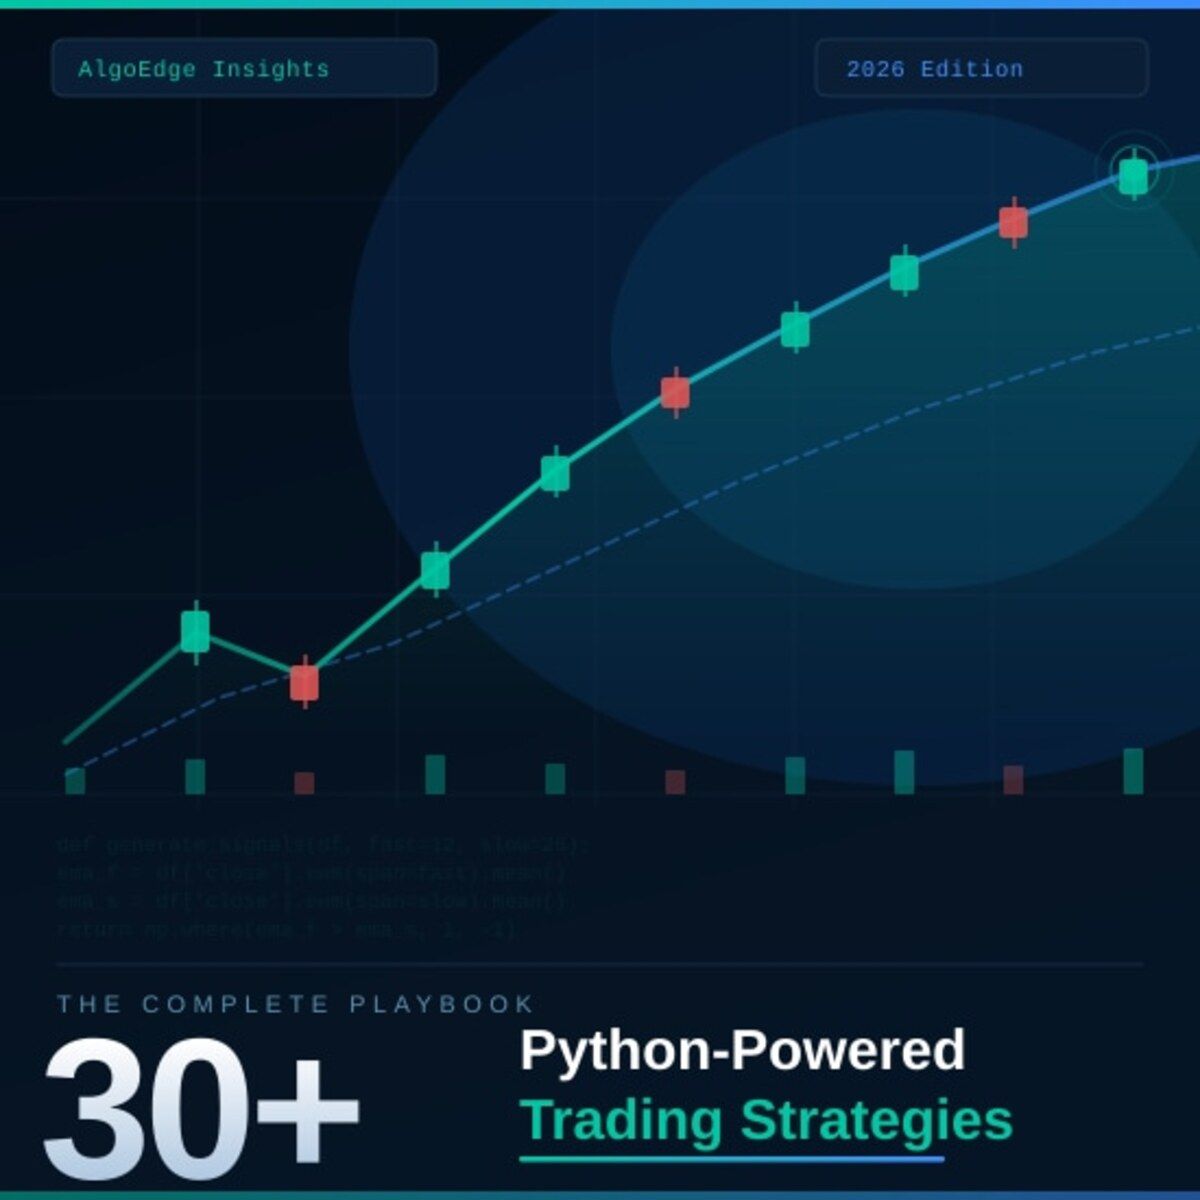
② One strategy in this book returned 2.3× the S&P 500 on a risk-adjusted basis over 5 years.
Fully coded in Python. Yours to run today.
The 2026 Playbook — 30+ backtested strategies,
full code included, ready to deploy.
20% off until Thursday. Use MAY2026 at checkout.
$79 → $63.20 · Expires May 20.
→ Grab it before Tuesday
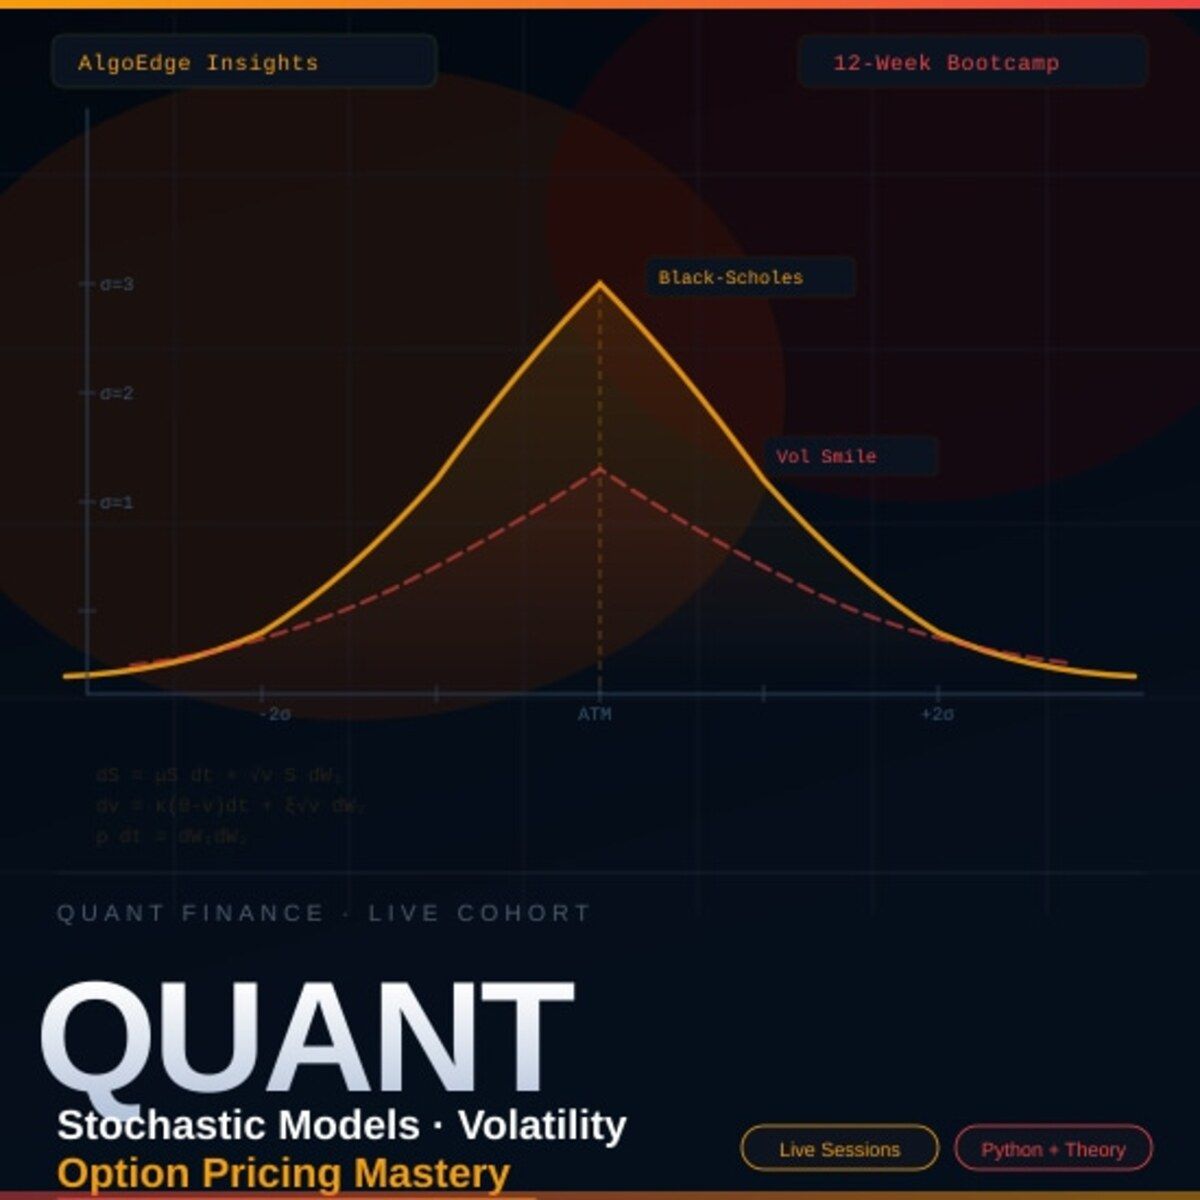
⑤ Most quant courses teach you to watch. This one makes you build.
Live. Weekly. With feedback on your actual code.
The AlgoEdge Quant Finance Bootcamp — 12 weeks of stochastic models, Black-Scholes, Heston, volatility surfaces, and exotic options. Built from scratch in Python.
Not pre-recorded. Not self-paced. Live sessions, weekly homework, direct feedback, and a full code library that's yours to keep.
Cohort size is limited intentionally — so every question gets answered.
→ Before you enroll, reach out for a 15-minute fit check. No pitch, no pressure.
📩 Email first: [email protected]
Premium Members – Your Full Notebook Is Ready
The complete Google Colab notebook from today’s article (with live data, full Hidden Markov Model, interactive charts, statistics, and one-click CSV export) is waiting for you.
Preview of what you’ll get:

Inside the Strategy Lab
Data Fetching — three data sources demonstrated side by side: Yahoo Finance (yfinance), EODHD APIs, and Twelve Data, all pulling 10 years of daily OHLCV data for SPY, GLD, and BTC
OHLC Visualization — interactive candlestick charts built with Plotly and VectorBT for all three assets, including volume panels
EMA Crossover Strategy — implements a long/cash signal (fast EMA > slow EMA = 1, otherwise 0) with a 1-day shift to avoid lookahead bias, then compares equity curves, rolling Sharpe, drawdowns, monthly returns, and buy/sell signal overlays against a buy-and-hold benchmark
Grid Search Optimization — exhaustive search over fast EMA (5–50) and slow EMA (20–200) combinations to find the Sharpe-maximising pair per asset, with Sharpe surface heatmaps showing the full parameter landscape
Out-of-Sample Testing — proper walk-forward validation with an 80/20 train/test split, optimizing on train and evaluating on unseen test data to guard against overfitting
VectorBT Backtesting — full backtests with 0.1% fees and $10k starting capital, producing detailed stats (win rate, profit factor, Calmar, Sortino, trade durations) and interactive trade plots
Regime Drawdown Analysis — three-panel chart overlaying strategy vs buy-and-hold drawdowns with green/red shading for bull and bear regimes
Conclusions — asset-specific takeaways: SPY benefits defensively, GLD is the cleanest trend-following fit, BTC is convex (few massive wins tolerating large drawdowns), and a core finding that no single EMA parameterisation generalises across all asset classes
Free readers – you already got the full breakdown and visuals in the article. Paid members – you get the actual tool.
Not upgraded yet? Fix that in 10 seconds here👇